A-mode
The A-mode is the oldest ultrasound technique and was invented in 1930. The transducer sends a single pulse of ultrasound into the medium. Consequently, a one-dimensional, simplest ultrasound image is created, on which a series of vertical peaks is generated when ultrasound beams encounter the boundaries of different tissues. The distance between the echoed spikes can be calculated by dividing the speed of ultrasound in the tissue (1540 m/s) by the elapsed time, but this provides little information about the spatial relationships among imaged structures.
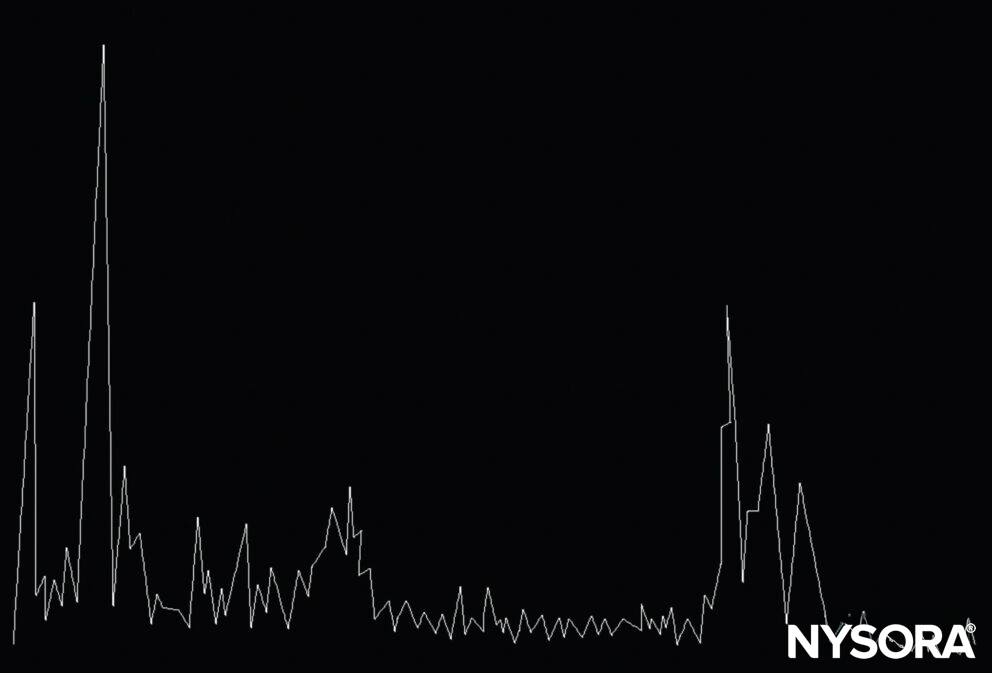
The A-mode of ultrasound is a one-dimensional image displayed as a series of vertical peaks corresponding to the depth of structures encountered in different tissues.
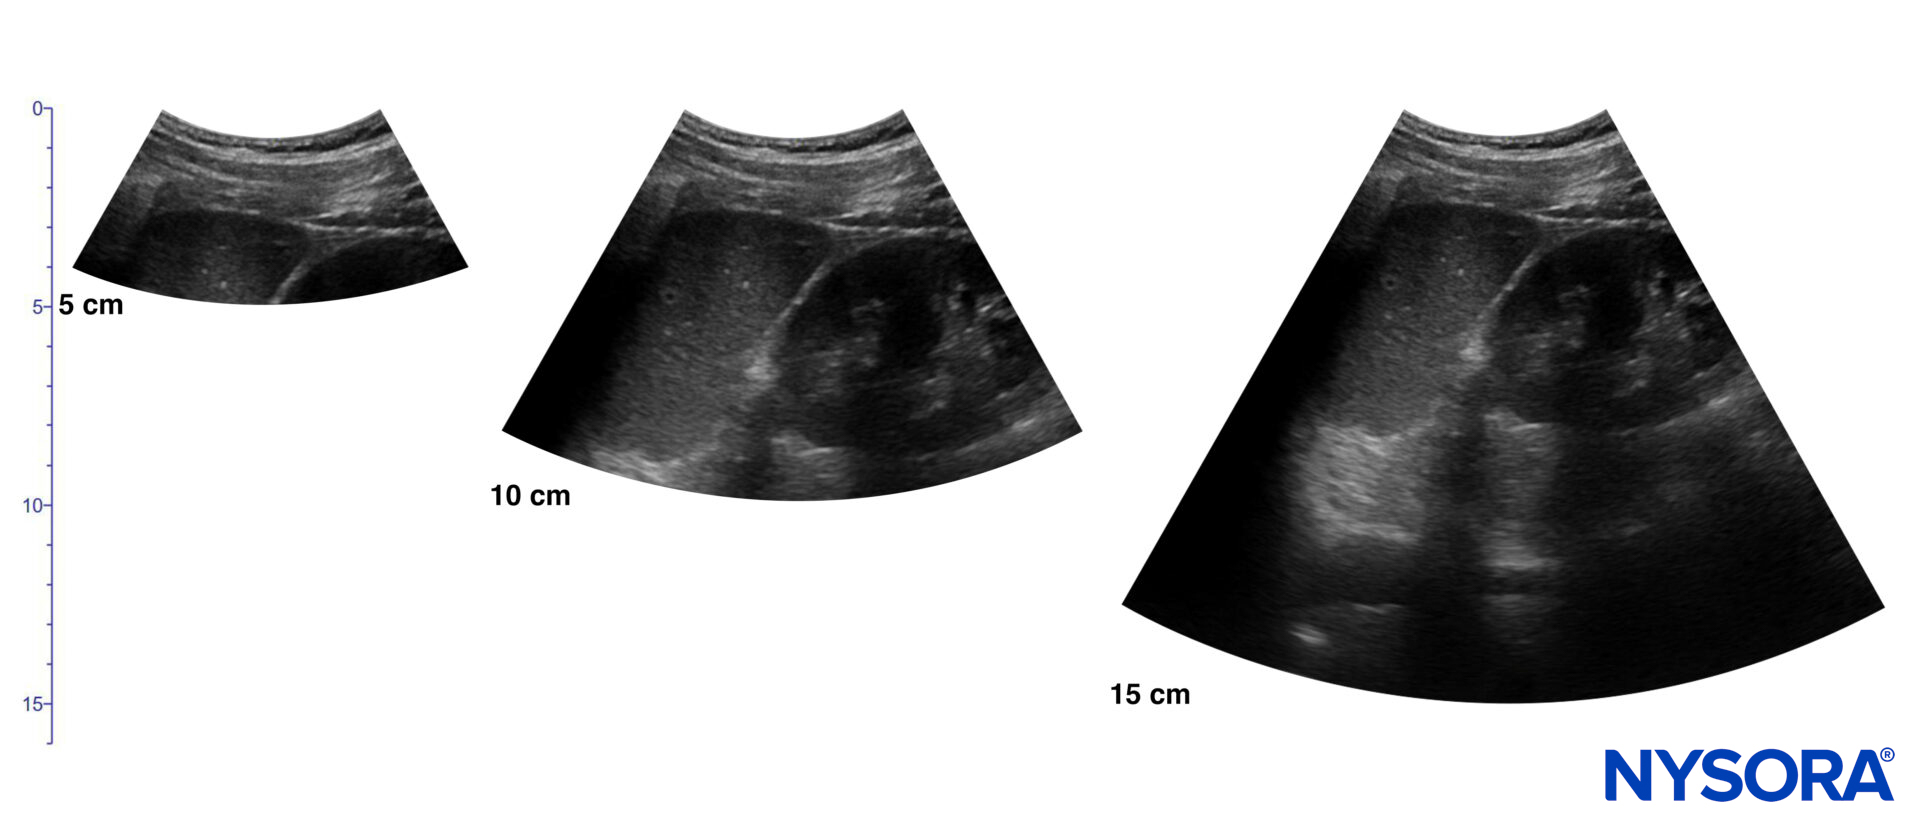
B-mode
The B-mode is a two-dimensional (2D) image of the area scanned simultaneously by a linear array of 100–300 piezoelectric elements, rather than a single element as in A-mode. The amplitude of the echo from a series of A-scans is converted into dots of different brightness in B-mode imaging. The horizontal and vertical directions represent real distances within the tissue, whereas the grayscale intensity indicates echo strength. B-mode can provide an image of a cross-section through the area of interest.

A. B-mode transducer, B. B-mode ultrasound image.
Doppler mode
The term describes a change in the frequency or wavelength of a sound wave caused by relative motion between the sound source and the receiver. In other words, at a stationary position, the sound frequency is constant. If the sound source moves toward the sound receiver, the sound waves have to be squeezed, and a higher-pitched sound occurs (positive Doppler shift); if the sound source moves away from the receiver, the sound waves have to be stretched, and the received sound has a lower pitch (negative Doppler shift).

The Doppler effect. When a sound source moves away from the receiver, the received sound has a lower pitch and vice versa.
The magnitude of the Doppler shift depends on the incident angle between the directions of the emitted ultrasound beam and the moving reflectors. With a 90° angle, there is no Doppler shift. If the angle is 0° or 180°, the largest Doppler shift can be detected. In medical settings, Doppler shifts are usually in the audible range.
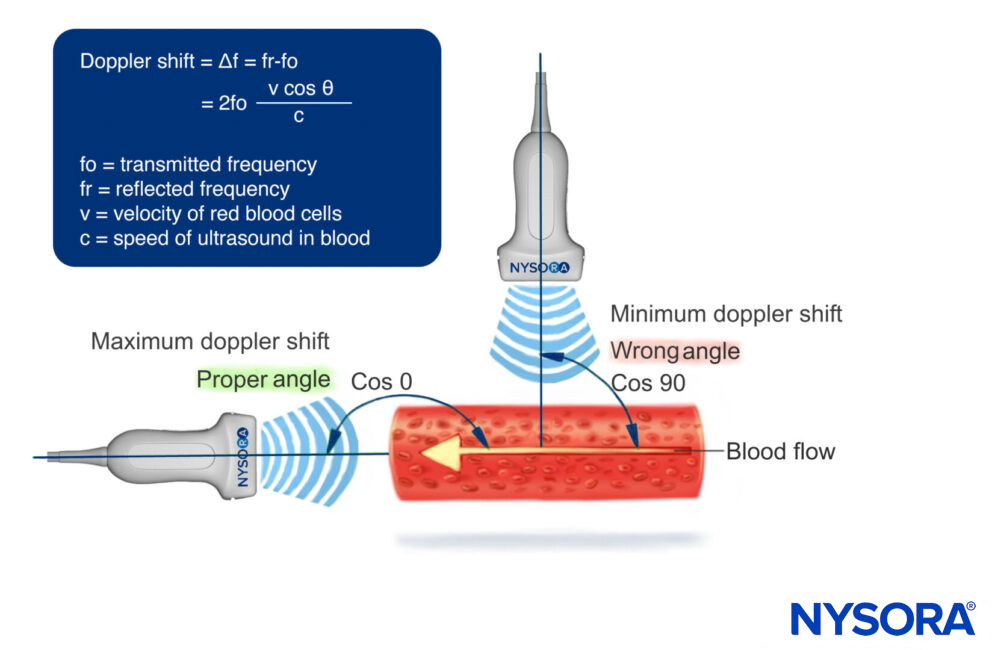
Doppler shifts in relation to the angle and the blood flow.
Color Doppler
Color Doppler produces a color-coded map of Doppler shifts superimposed onto a B-mode ultrasound image. Blood flow direction depends on whether the motion is toward or away from the transducer. Red and blue colors indicate the direction and velocity of blood flow. According to the color map (color bar) in the upper left-hand corner of the figure, the red color on the top of the bar denotes the flow coming toward the ultrasound transducer, and the blue color on the bottom of the bar indicates the flow away from the transducer. When the direction of the ultrasound beam changes, the color of the arterial flow switches from blue to red, or vice versa, depending on the convention used.

This illustration shows the use of color Doppler via a color-coded map of Doppler shifts that indicate motion toward or away from the ultrasound transducer. The mnemonic BART can be helpful to remember the directions of the flow: ‘Blue Away, Red Towards’ the transducer.
Power Doppler
Power Doppler is up to 5 times more sensitive than color Doppler for detecting blood flow, and it is less dependent on the scanning angle. Thus, power Doppler can be used to more reliably identify smaller blood vessels. The drawback is that power Doppler does not provide any information on the direction and speed of blood flow.
Spectral Doppler
Spectral Doppler is another way to visualize the Doppler principle through graphical peaks. Blood flow toward the ultrasound transducer will be imaged above the baseline, and flow away from the transducer below the baseline.
Continuous-wave Doppler can accurately measure high velocities by using different piezoelectric crystals for both transmission and reception. It is not possible to determine the position where these velocities are measured along the Doppler line. The velocity is thus more important than the location (e.g., peak flow over the aortic valve).
Pulsed wave Doppler, however, can be used to measure velocities in exact locations (e.g., a vessel). This will require the user to set a correct Nyquist limit to prevent aliasing and ensure the velocity and direction can be measured. The greater the blood flow velocity, the greater the Doppler shift. The correct Nyquist limit has a pulse repetition frequency that is twice the Doppler shift or just high enough without aliasing to occur. This can be adjusted by modifying the baseline or the Nyquist limit.
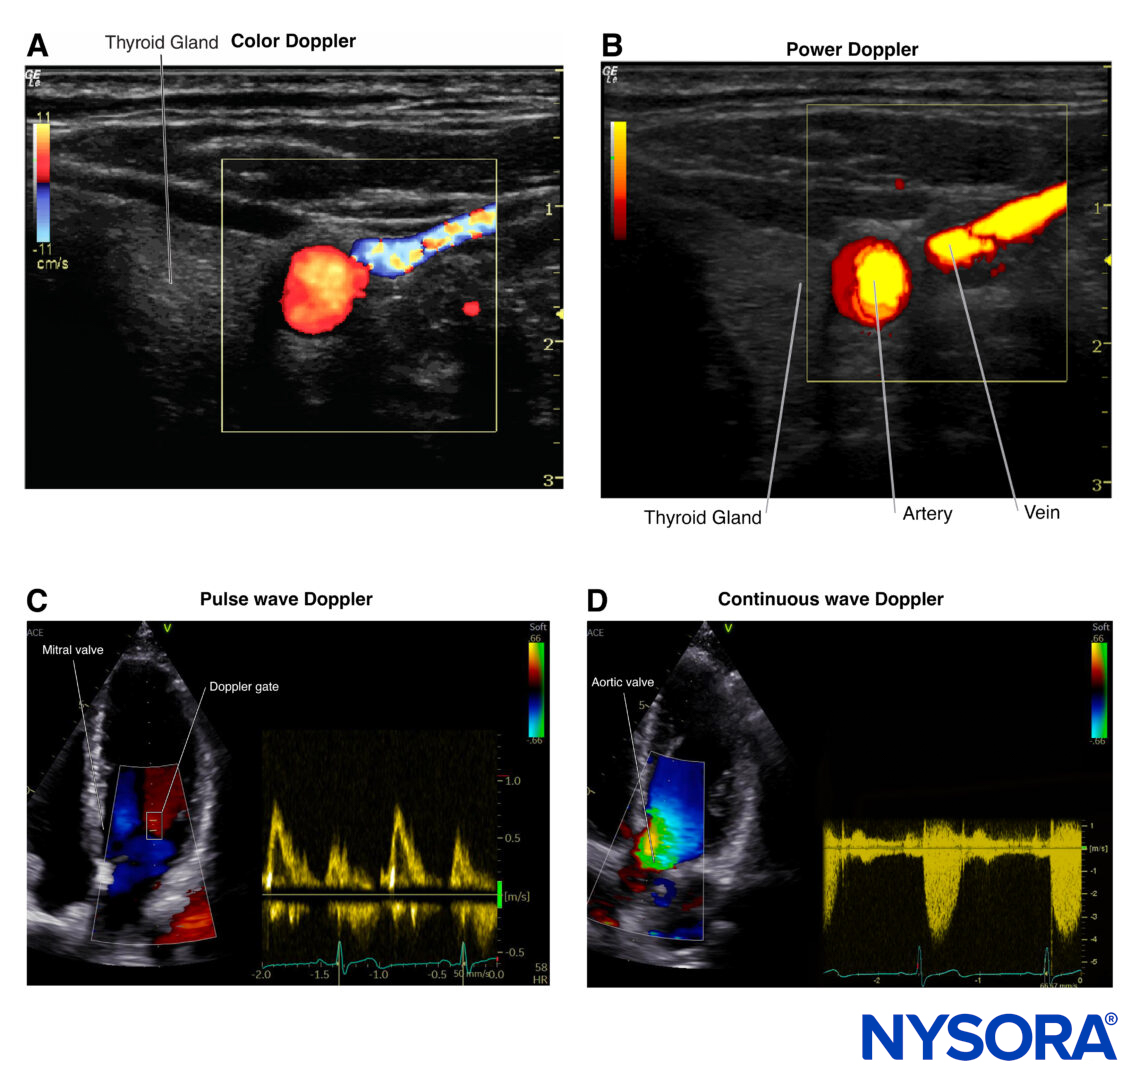
A. Color Doppler, B. Power Doppler, C. Pulsed wave Doppler, D. Continuous wave Doppler.
M-mode
A single beam in an ultrasound scan can be plotted in function of time. This produces a picture with a motion signal, in which the movement of a structure, such as a heart valve, can be depicted as a wave. M-mode is used extensively in cardiac and fetal cardiac imaging.
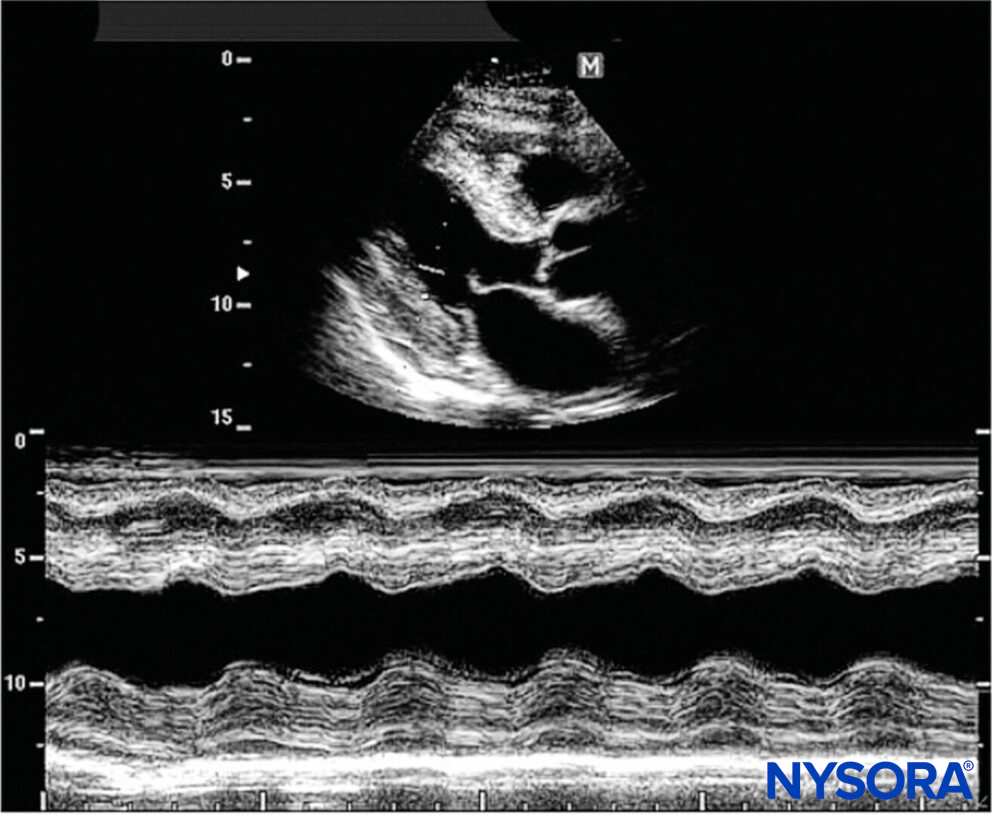
M-mode: The vertical structure is the image plane, while the horizontal is time.