P-values are often sought as some kind of Holy Grail in science. Arguably one of the most controversial topics in statistics, we start our 2016 series of ‘statistics in small doses’ with a description of what p-values really are and how they can, in fact, be misleading. The 2016 series then continues with something more useful, that is, confidence intervals.
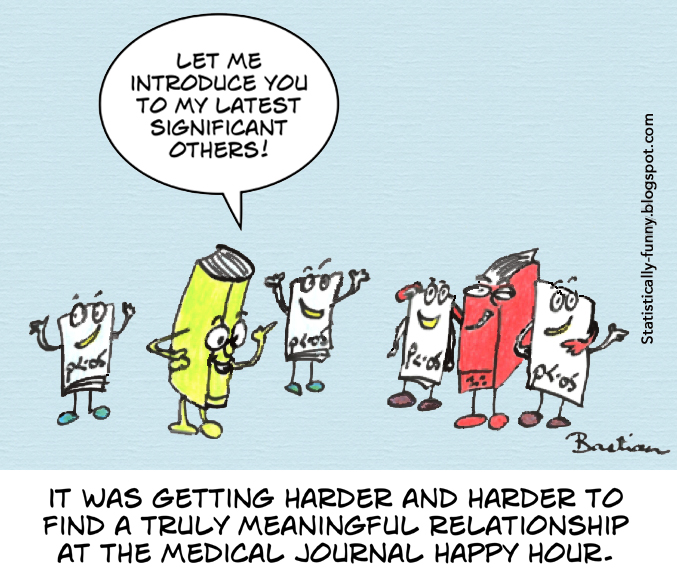
In the basic randomized clinical trial of new treatment v standard treatment (or control), statistical tests are run to compare these ‘arms’ of the trial on some hypothesized outcome measure, and voilà, out pops a p-value! The p-value is the probability that effects as large as those seen in a study would be observed if there is really no difference in outcome between the arms of the trial. If that probability is small (say, p < 0.05), the data are unlikely to have arisen by chance, and we typically rejoice that our outcome differs between treatment and control groups. If that probability is large (say, p > 0.05), we may be forlorn because, after all of our work, the data could have arisen by chance, and we are not able to say one way or another whether our outcome differs between treatment and control groups. Investigators have even p-hacked their data to see whether the numbers can be massaged into “statistically significant” findings. Regrettably, these investigators have been side-tracked by the p-value.
There is a tendency to equate statistical significance with medical importance or biological relevance. But small effects of no real interest can reach statistical significance with large sample sizes; conversely, clinically important effects may not be able to reach statistical significance only because the number of subjects studied was small. In summary, p-values restrict our thinking to two alternative outcomes – significant or not significant – and even precise p-values tell us nothing about the sizes of the differences between or among study groups. Stay tuned for confidence intervals to the rescue!


