Intraoperative hypotension (IOH), a drop in blood pressure during surgery, is a significant clinical concern, often linked to organ injury, prolonged hospital stays, and increased mortality. As anesthesia practices evolve, the integration of predictive analytics using machine learning tools offers a promising approach to minimizing hypotensive episodes. But are these technologies truly ready for prime time?
A recent article by Mukkamala et al. (A&A, 2025) reviews the latest evidence, explores controversies surrounding current prediction tools, and outlines the future direction of intraoperative hypotension prediction.
Why does intraoperative hypotension matter?
- IOH is associated with poor clinical outcomes, including:
- Cardiac injury
- Acute kidney injury
- Central nervous system complications
- Increased postoperative mortality
- Cardiac injury
- No universal definition exists, but:
- A mean arterial pressure (MAP) below 65 mm Hg is commonly used.
- Risk increases with the duration and depth of hypotension.
- A mean arterial pressure (MAP) below 65 mm Hg is commonly used.
From reactive to proactive: the goal of hypotension prediction
Modern prediction tools aim to:
- Anticipate IOH before it occurs
- Enable early therapeutic intervention
- Reduce exposure time to hypotension
- Personalize treatment based on individual risk factors
The hypotension prediction index (HPI): leading the field
The Acumen HPI by Edwards Lifesciences is the most studied tool available.
How it works:
- Analyzes 23 proprietary features from arterial pressure waveforms.
- Predicts hypotension (MAP < 65 mm Hg for ≥ 1 minute) within a 15-minute window.
- Outputs a risk score from 0 to 100.
- An HPI > 85 suggests imminent hypotension.
Controversies and limitations:
- Initial studies reported high accuracy (ROC AUC > 0.9).
- However, these were based on data stratification that may have overestimated performance.
- Subsequent real-world evaluations show:
- Similar predictive power to simply monitoring the current MAP.
- A positive predictive value (PPV) of only ~30%.
- Clinical equivalence between HPI and using a MAP threshold of 72–73 mm Hg.
- Similar predictive power to simply monitoring the current MAP.
Clinical impact: Can prediction tools reduce injury?
Findings from clinical trials:
- Some trials show reduced hypotension exposure with HPI-guided care.
- Yet, no consistent evidence of reduced:
- Organ damage
- ICU stays
- Long-term postoperative complications
- Organ damage
Risk of overtreatment:
- A high false-positive rate leads to unnecessary interventions.
- Treating patients not truly at risk increases:
- Exposure to fluids
- Use of vasopressors
- Risk of hypertension-related side effects
- Exposure to fluids
Alternative methods and machine learning models
Numerous studies have explored different approaches beyond the HPI.
Key insights:
- MAP remains the most predictive variable.
- Additional data (e.g., age, comorbidities, waveform shape) offers minimal added value.
- Advanced machine learning techniques (e.g., deep learning, random forests) do not consistently outperform basic logistic regression.
How far ahead can we predict?
- Most effective predictions occur 15 minutes before a hypotensive event.
- Predicting > 30 minutes ahead greatly reduces accuracy.
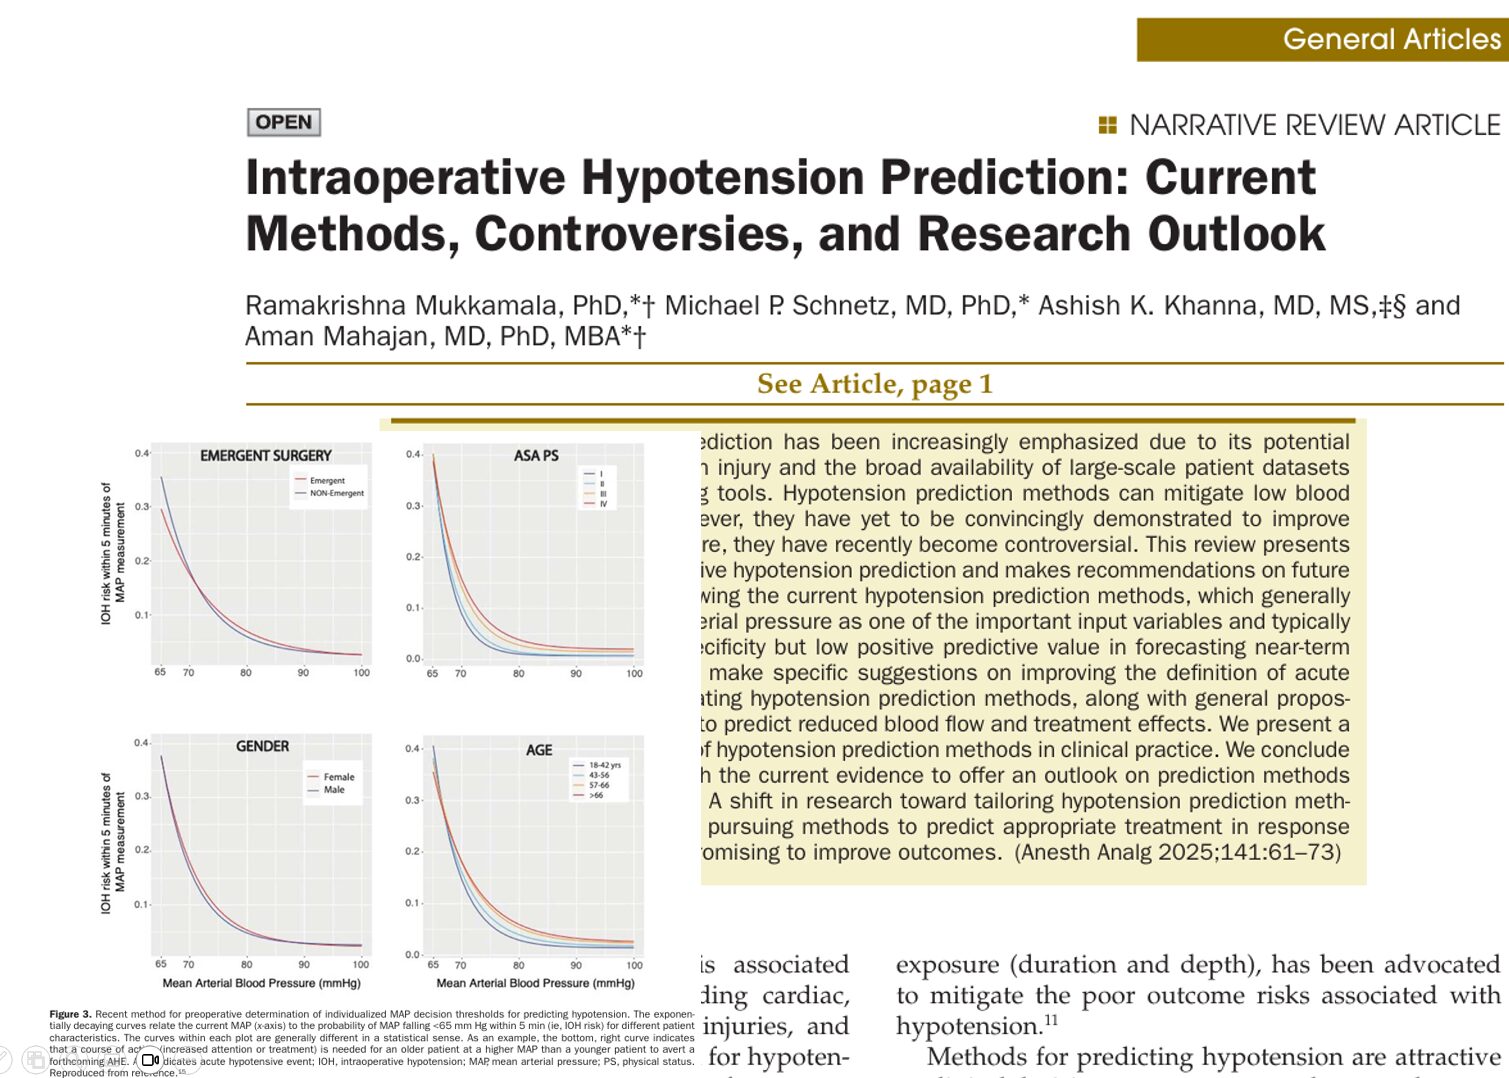
Individualizing MAP thresholds
A novel method tailors MAP thresholds using:
- Age
- Gender
- ASA physical status
- Surgical urgency
This produces individualized risk curves, allowing clinicians to set custom thresholds for preemptive treatment.
Redefining hypotension: Is our current approach too simplistic?
Current definitions utilize threshold-based metrics (e.g., MAP < 65 mmHg for 1–5 minutes). However, new studies suggest using:
- Area under the curve (AUC) of MAP <65 mm Hg
- This better correlates with postoperative injury, especially when the AUC exceeds 150 mm Hg-min
Improving evaluation metrics
Most studies rely on:
- ROC curves (sensitivity vs. specificity)
But this may be misleading due to the low prevalence of hypotensive events.
Suggested improvements:
- Use precision-recall (PR) curves to highlight:
- Positive predictive value (PPV)
- Real-world clinical applicability
- Positive predictive value (PPV)
Risk-benefit analysis: how many are helped?
A simulation using clinical data suggests:
- Out of 1000 patients:
- 20 patients may avoid injury through correct prediction and treatment.
- But 150 patients may receive unnecessary interventions due to false alarms.
- 20 patients may avoid injury through correct prediction and treatment.
Key recommendations for future research
Define hypotension more precisely:
- Use the cumulative area under the MAP curve instead of binary thresholds.
- Customize thresholds based on patient characteristics.
Improve evaluation:
- Analyze full patient records, not event-only datasets.
- Report positive predictive value, not just sensitivity/specificity.
Extend capabilities:
- Predict blood flow changes and treatment response.
- Use machine learning to propose tailored interventions.
Conclusion: Is hypotension prediction ready for clinical use?
The current generation of IOH prediction tools offers valuable insight, but:
- Their clinical utility remains limited by high false-positive rates.
- There is no clear outcome benefit in preventing long-term injury.
- Personalization and therapeutic guidance are essential next steps.
As research continues, the integration of individualized thresholds, improved evaluation, and cause-specific predictions may transform the way we manage hypotension in the OR, but until then, caution and critical appraisal of these tools remain necessary.
For more detailed information, refer to the full article in A&A.
Mukkamala R. Anesth Analg. 2025;141:61–73.
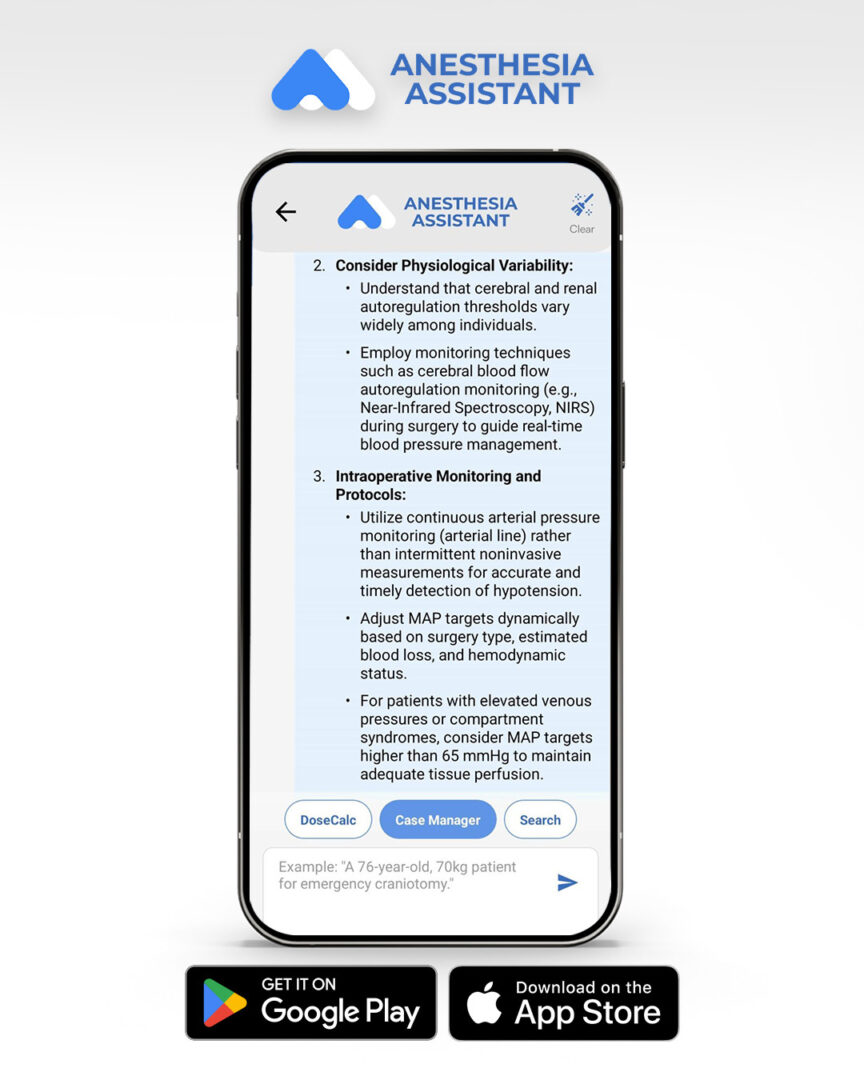
For additional resources on patient blood pressure optimization and intraoperative monitoring, check out Anesthesia Updates on the NYSORA Anesthesia Assistant App.
Get access to step-by-step management algorithms, the latest research, and peer-reviewed insights—all in one place. Download the app today and experience the future of anesthesia education and decision-making.