


Manoj K. Karmakar and Ki Jinn Chin
INTRODUCTION
Central neuraxial blocks (CNBs), which include spinal, epidural, combined spinal-epidural (CSE), and caudal epidural injections, are commonly practiced regional anesthesia techniques and frequently used in the perioperative period for anesthesia and analgesia and for managing chronic pain. Traditionally, CNBs are performed using a combination of surface anatomical landmarks, the operator’s perception of tactile sensation (loss of resistance) during needle advancement, and/or visualizing the free flow of cerebrospinal fluid. Although the spinous processes are relatively reliable surface anatomical landmarks in many patients, they are not always easily recognizable in patients with obesity, edema, underlying spinal deformity, or previous back surgery. Tuffier’s line, which connects the highest points of the iliac crests, is another surface anatomical landmark that is widely used to estimate the location of the L3–L4 interspace; however, the correlation is inconsistent.
Even in the absence of spine abnormalities, estimation of a specific intervertebral level may not be accurate in many patients and may result in needle placement one or two spinal levels higher than intended. The difficulty in identifying the correct spinal level is exaggerated in patients with obesity and in the upper spinal levels. This inaccuracy has been implicated in cases of injury to the conus medullaris after spinal anesthesia. Moreover, surface landmarks alone do not allow the operator to reliably predict the ease or difficulty of needle placement prior to skin puncture. Unanticipated technical difficulty, multiple attempts at needle placement, and failure of CNB are therefore not uncommon. Recently, however, ultrasound (US) imaging of the spine has emerged as a useful method of overcoming many of these shortcomings of the surface landmark-guided approach to CNBs.
US imaging offers several advantages when used to guide needle placement during CNBs. It is noninvasive, safe, simple to use, can be performed expeditiously at the point of care, provides real-time images, is devoid of significant adverse effects, and is particularly helpful in delineating abnormal or variant spinal anatomy. When used for chronic pain interventions of the spine, US can reduce or eliminate exposure to ionizing radiation. Presently, US is most frequently used as a preprocedural tool, but it can also be used for real-time needle guidance during CNBs.
During the preprocedural scan, one can accurately locate the midline, identify a given lumbar interspace, predict the depth to the epidural space, and identify patients in whom a CNB may be difficult. In expert hands, the use of US for epidural needle insertion reduces the number of puncture attempts, improves the success rate of epidural access on the first attempt, reduces the need to puncture multiple levels, and improves patient comfort during the procedure. However, despite its advantages, the integration of US into clinical practice for CNBs is still in its infancy. A recent survey of anesthesiologists in the United Kingdom showed that more than 90% of respondents were not trained to image the epidural space using US despite national guidelines advocating its use. In this section, we describe techniques of spinal sonography, the relevant sonoanatomy, and practical considerations for using US for CNBs.
HISTORICAL BACKGROUND
Bogin and Stulin were probably the first to report the use of US for central neuraxial interventional procedures. In 1971, they described using US for lumbar puncture. Porter and colleagues, in 1978, used US to image the lumbar spine and measure the diameter of the spinal canal in diagnostic radiology. Cork and colleagues were the first group of anesthesiologists to use US to locate the landmarks relevant for epidural anesthesia. Thereafter, US was used mostly to preview the spinal anatomy and measure the distances from the skin to the lamina and epidural space before epidural puncture. Between 2001 and 2004, Grau and colleagues, from Heidelberg, Germany, published a series of studies that formed the foundation of the clinical application of US for CNB. Subsequent improvements in US technology and image processing software have allowed for greater image clarity of the spine and neuraxial structures. Also, the increasing availability of point-of-care US systems has led to further research by other investigators, which has established our current understanding of spinal sonoanatomy.
GROSS ANATOMY OF THE SPINE
The gross anatomy of the spine has been discussed in detail in Ultrastructural Anatomy of the Spinal Meninges and Related Structures and Neuraxial Anatomy (Anatomy Relevant to Neuraxial Anesthesia). In this section, the anatomy relevant for US imaging of the spine is briefly reviewed. A vertebra is made up of two components: the vertebral body and the vertebral arch (Figure 1). The vertebral arch is formed by the supporting pedicles and laminae (Figure 2). Seven processes arise from the vertebral arch: one spinous process, two transverse processes, two superior articular processes, and two inferior articular processes (see Figures 1 and 2).
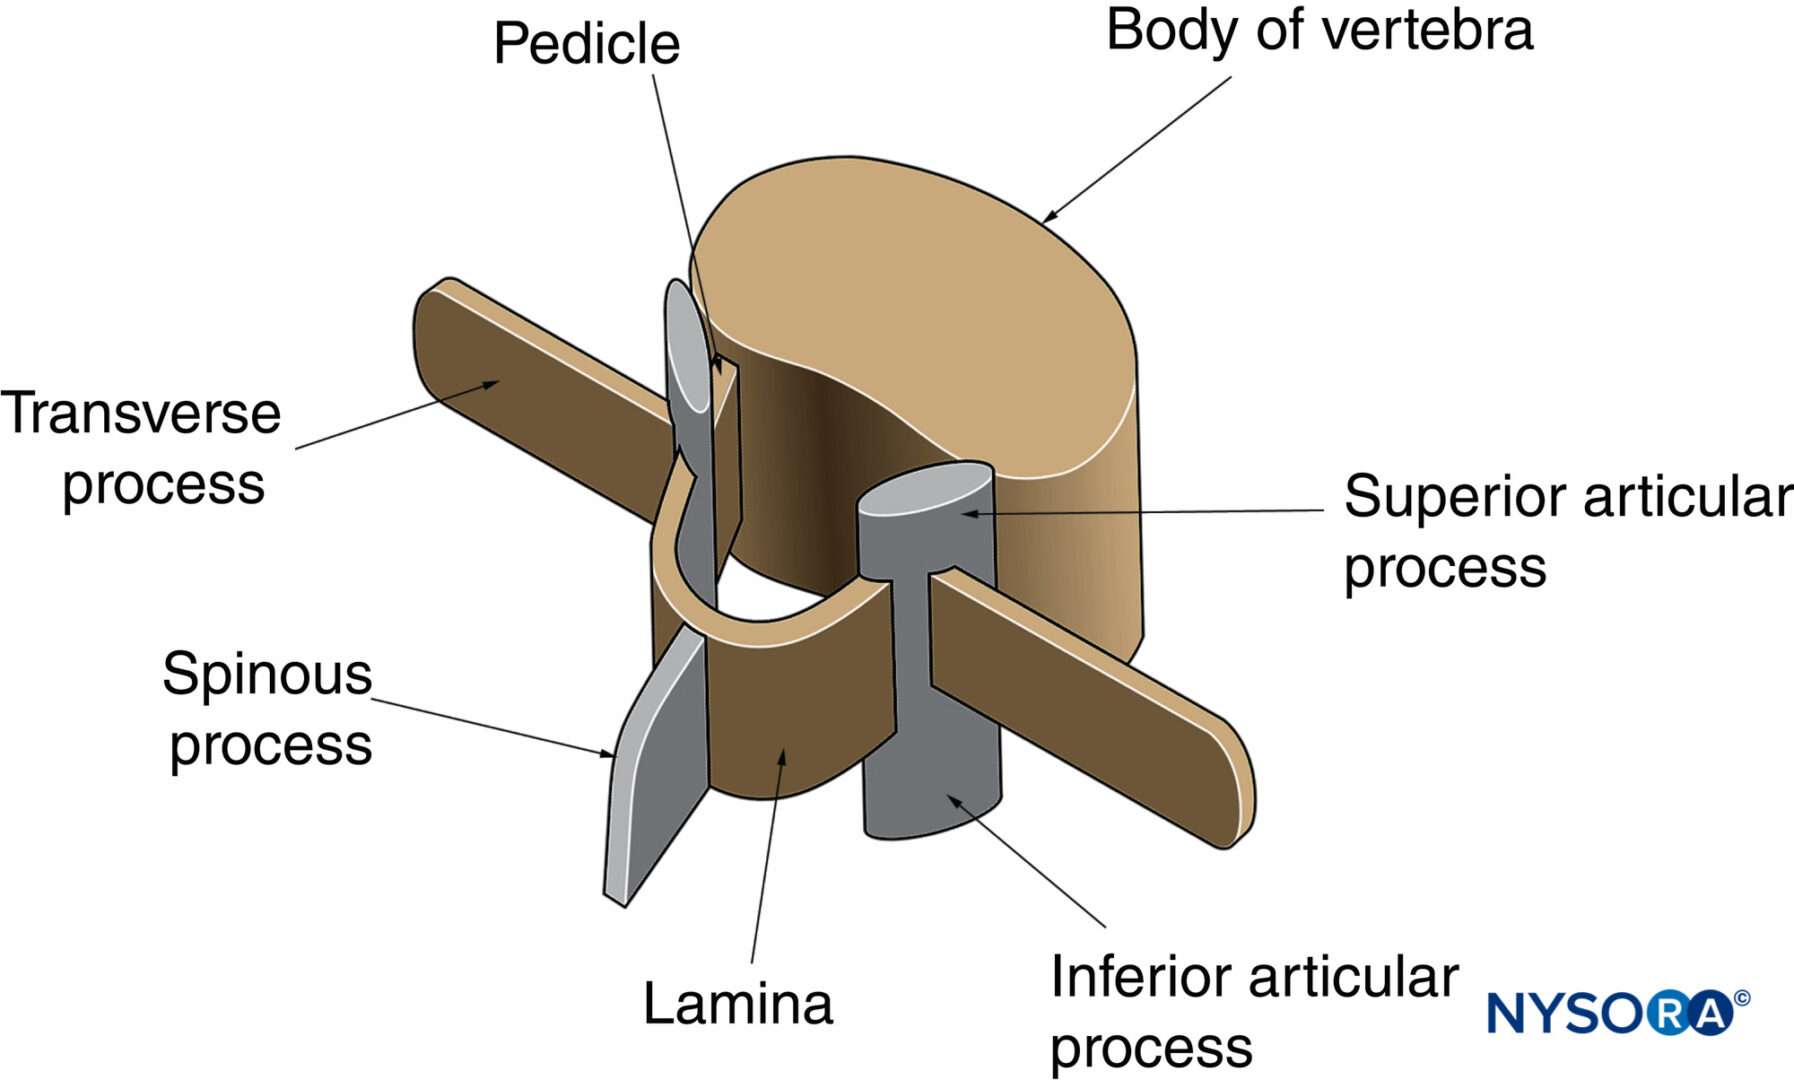
FIGURE 1. The components of a typical lumbar vertebra.
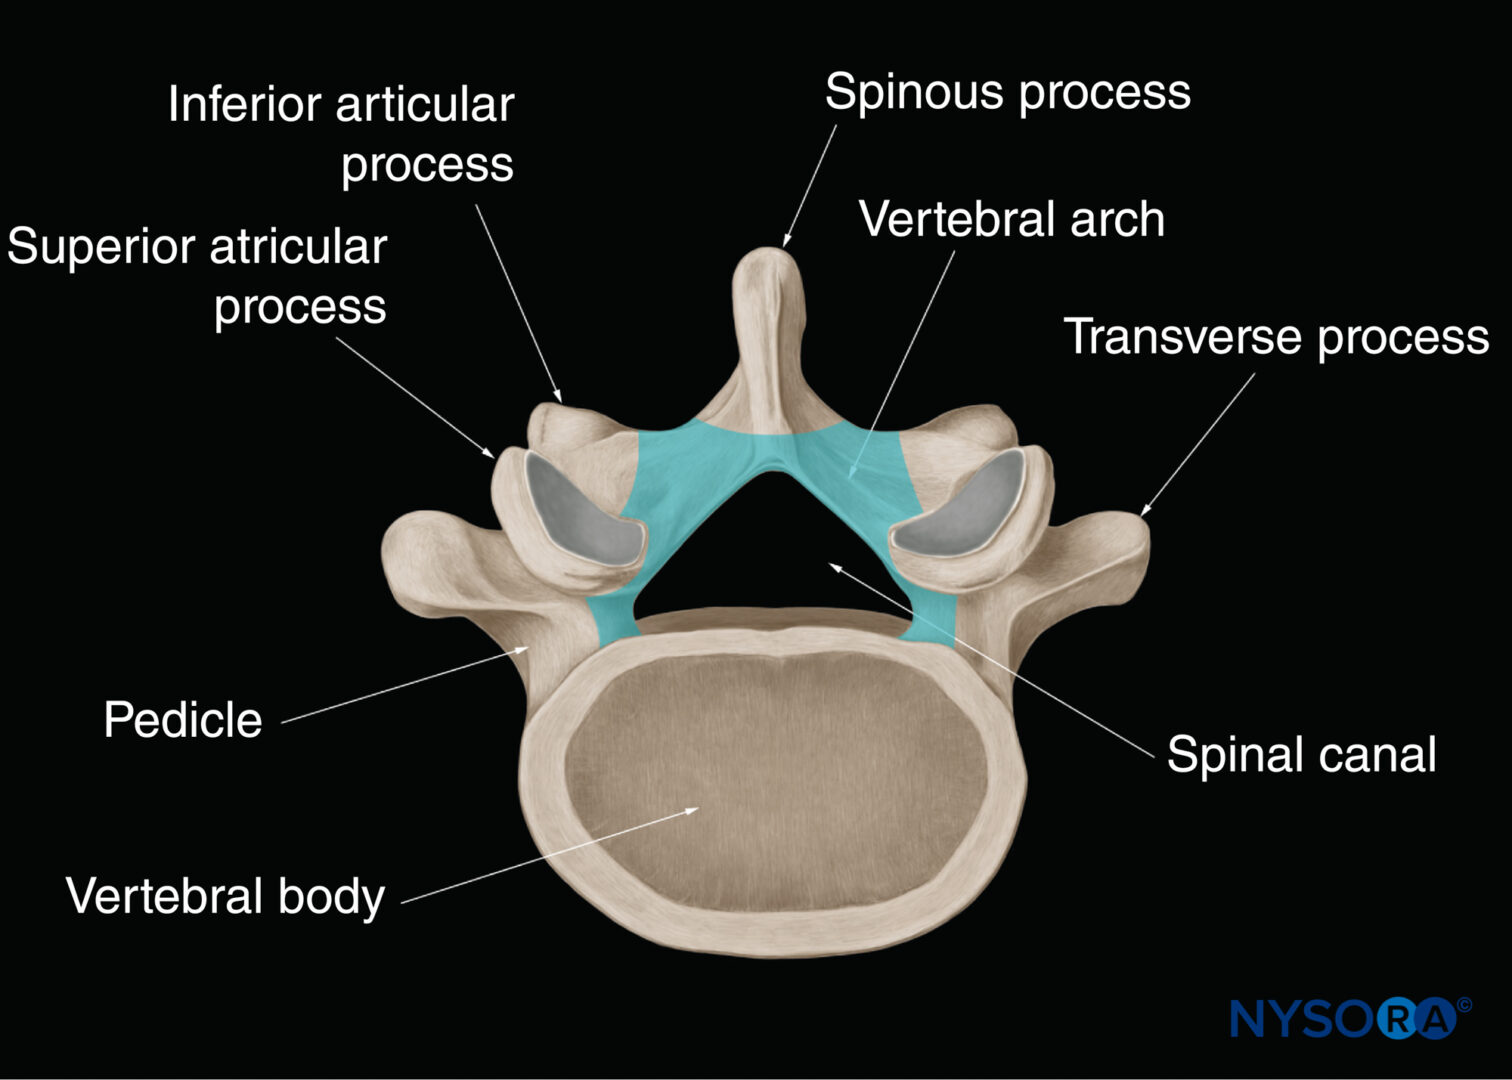
FIGURE 2. Vertebral arch of a typical lumbar vertebra. The vertebral arch surrounds the spinal canal and is made up of the posterior surface of the vertebral body, the pedicles, and the laminae.
Adjacent vertebrae articulate with each other at the facet joints between the superior and inferior articular processes and the intervertebral disc between the vertebral bodies. This produces two gaps: one between the spinous processes, the “interspinous space” (Figure 3), and one between the laminae, the “interlaminar space” (Figure 4). It is through these spaces that the US energy enters the spinal canal and makes spinal sonography and CNBs possible.
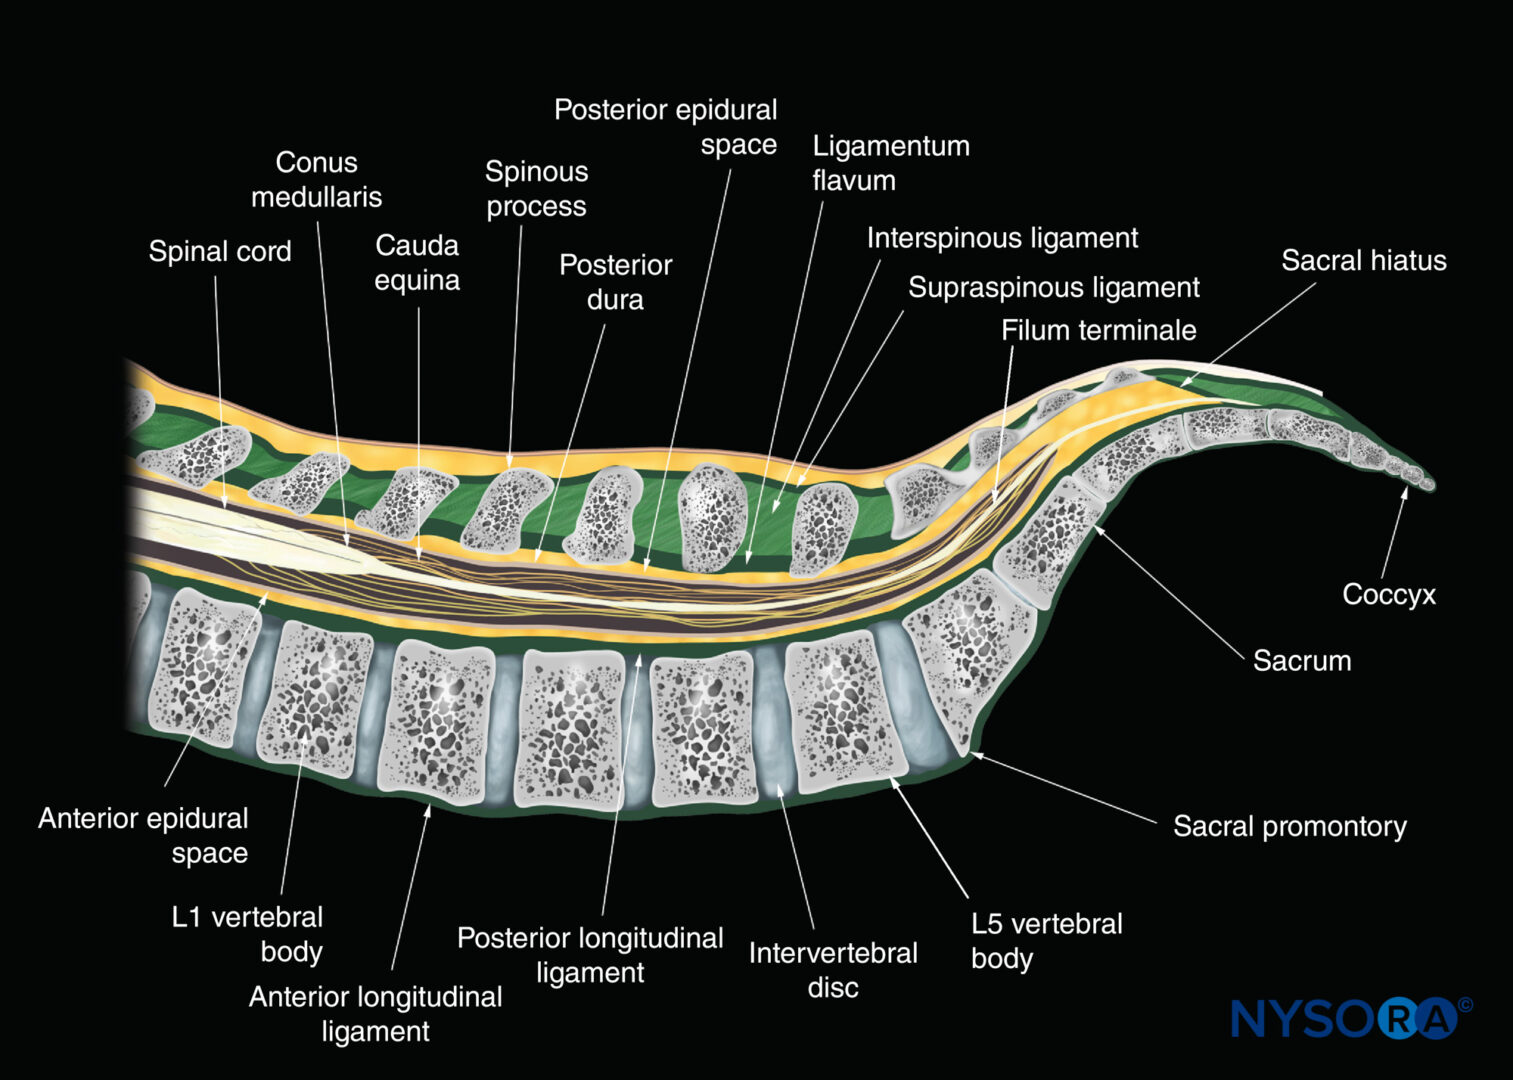
FIGURE 3. Sagittal anatomy of the lumbosacral spine in the median plane.

FIGURE 4. Paramedian sagittal MRI section of the lumbar spine at the level of the lamina.
The three major ligaments of the spine are the ligamentum flavum (Figures 3, 4, and 5), the anterior longitudinal ligament, and the posterior longitudinal ligament (see Figure 3). The posterior longitudinal ligament is attached along the length of the anterior wall of the vertebral canal (see Figures 3, 4, and 5). The ligamentum flavum, also referred to as the yellow ligament, is a dense layer of connective tissue that bridges the interlaminar spaces (see Figure 4) and connects the laminae of adjacent vertebrae. It is arch-like on cross-section and is widest posteriorly in the midline and in the lumbar region (see Figure 5). The ligamentum flavum is attached to the anterior surface of the inferior margin of the lamina above but splits inferiorly to attach to both the posterior surface (superficial component) and anterior surface (deep component) of the lamina below. The spinous processes are attached at their tips by the supraspinous ligament, which is thick and cord-like, and along their length by the interspinous ligament, which is thin and membranous (see Figure 3). The spinal (vertebral) canal is formed by the vertebral arch and the posterior surface of the vertebral body (see Figures 2 and 5). The openings into the spinal canal are through the intervertebral foramen along its lateral wall and the interlaminar space on its posterolateral wall. Within the spinal canal lies the thecal sac (formed by the dura mater and arachnoid mater; see Figure 5) and its contents (the spinal cord, cauda equina, and cerebrospinal fluid; see Figures 3 and 5).
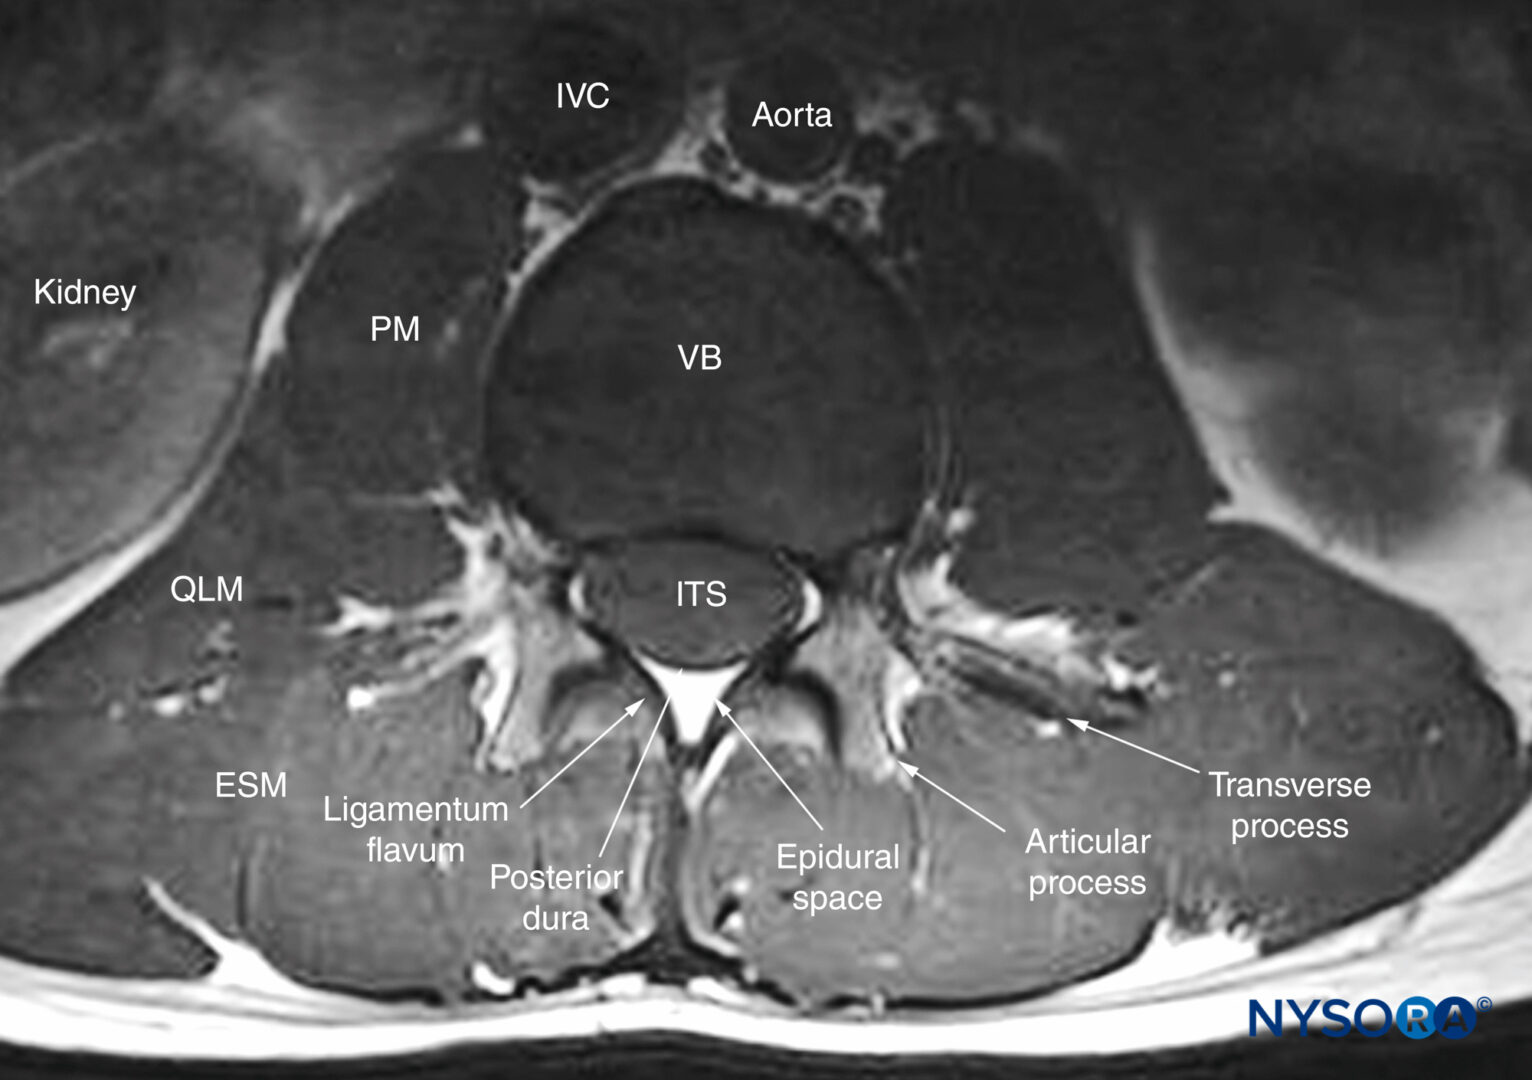
FIGURE 5. Transverse MRI section of the lower lumbar spine through the interspinous space. Note the relationship of the articular process to the transverse process and the attachment of the ligamentum flavum to the lamina on either side. Also, note that the anterior epidural space is barely seen and that the anterior dura is very closely apposed to the posterior longitudinal ligament of the vertebra. ESM, erector spinae muscle; ITS, intrathecal space; IVC, inferior vena cava; PM, psoas major muscle; QLM, quadratus lumborum muscle; VB, vertebral body.
The spinal cord extends from the foramen magnum to the conus medullaris, near the lower border of the first lumbar vertebra (see Figure 3), finally terminating as the filum terminale. However, there is normal variation in the position of the conus medullaris, and it may extend anywhere from T12 to the upper third of L3. The cauda equina, named after its resemblance to a horse’s tail, is made up of lumbar, sacral, and coccygeal nerves that originate in the conus medullaris and descend caudally to exit the spinal canal through their respective intervertebral foramina. Similarly, the dural sac is classically described as ending at the level of the second sacral vertebra (S2) (see Figure 3), but this can vary from the upper border of S1 to the lower border of S4. The epidural space is an anatomical space within the spinal canal but outside the dura mater (referred to as extradural; see Figures 3 and 5). It extends from the level of the foramen magnum cranially to the tip of the sacrum at the sacrococcygeal ligament (see Figure 3). The posterior epidural space is of importance for CNBs. The only structure of importance in the anterior epidural space for neuraxial blocks is the internal vertebral venous plexus.
ULTRASOUND IMAGING OF THE SPINE
Foundation
Located at a depth of several centimeters or more in adults, US imaging of the spine typically requires the use of low-frequency US (2–5 MHz) and curved array transducers. Because of the divergent nature of their US beam, curved array transducers also produce a wide field of view, particularly in the deeper areas, which is useful when using US for CNB. Low-frequency US provides adequate penetration, but unfortunately lacks spatial resolution at the depth (5–7 cm) at which the neuraxial structures are located. The osseous framework of the spine, which envelops the neuraxial structures, reflects much of the incident US signal before it even reaches the spinal canal, presenting additional challenges in acquiring good-quality images. However, this challenge is often offset by improved image processing and advanced image optimization modes in modern US systems, and thus high-quality images of the neuraxis can still be obtained with low-frequency transducers. Also of note is that technology once only available in the high-end cart-based US systems is now available in portable US devices, making US systems even more practical for spinal sonography and US-guided (USG) CNB applications.
Scanning Planes
Although anatomical planes have already been described elsewhere in this text, the importance of understanding them for imaging of the spine dictates a further, more detailed review. There are three anatomical planes: median, transverse, and coronal (Figure 6). The median plane is a longitudinal plane that passes through the midline, bisecting the body into two equal right and left halves. The sagittal plane is a longitudinal plane that is parallel to the median plane and perpendicular to the ground. Therefore, the median plane can also be defined as the sagittal plane that is exactly in the middle of the body (median sagittal plane). The transverse plane, also known as the axial or horizontal plane, is parallel to the ground.
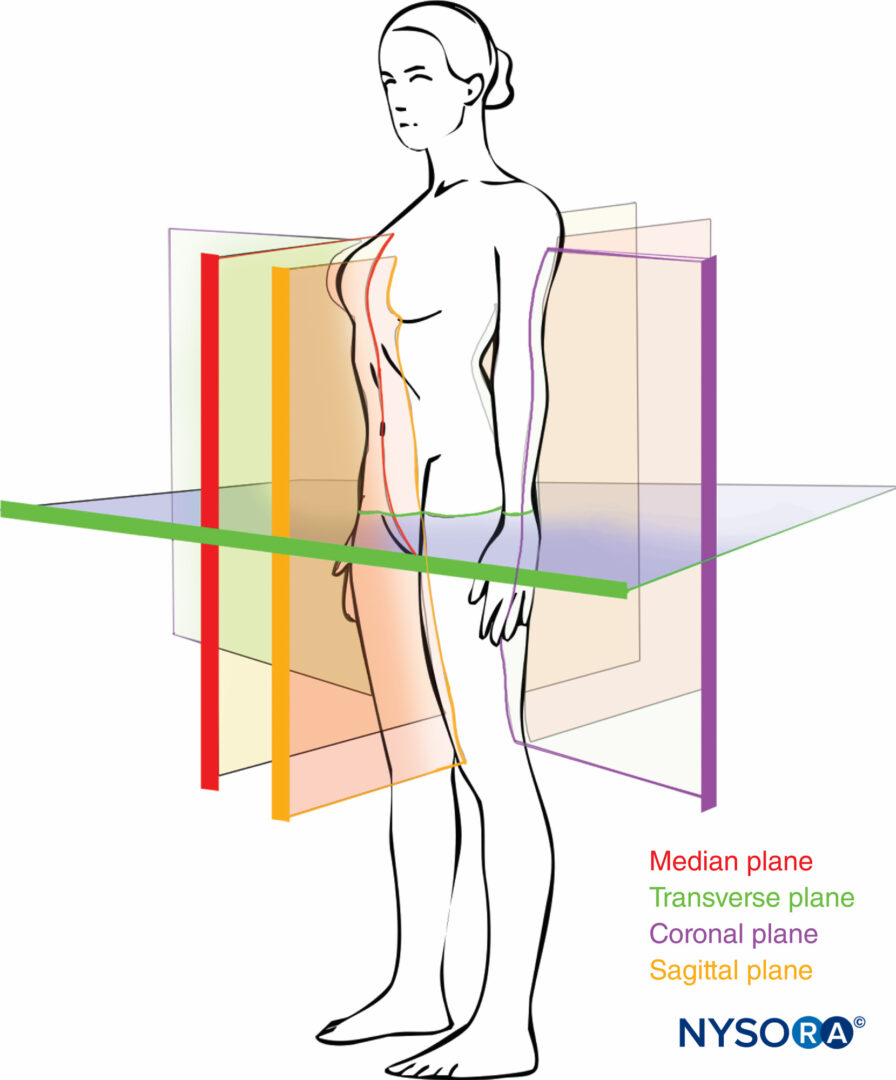
FIGURE 6. Anatomical planes of the body.
The coronal plane, also known as the frontal plane, is a vertical plane that is perpendicular to the ground and at right angles to the sagittal plane dividing the body into an anterior and a posterior part.
Axis of Scan
US imaging of the spine can be performed in the transverse axis (transverse scan; Figure 7) or the longitudinal axis (sagittal scan; Figure 8) with the patient in the sitting, lateral decubitus, or prone position. The anatomical information obtained from these two scan planes complements each other during a US examination of the spine. A transverse scan can be performed over the spinous process (see Figure 7a) or through the interspinous/interlaminar space (see Figure 7b). The former produces the transverse spinous process view, whereas the latter produces the transverse interspinous view of the spine. Transverse views are relatively easy to acquire in the lumbar region, but the transverse interspinous view is challenging in the midthoracic region (T4–8) due to the acute caudal angulation of the spinous processes. Depending on the angle of the spinous processes, the transducer may have to be tilted to produce an optimal interspinous view of the neuraxial structures.
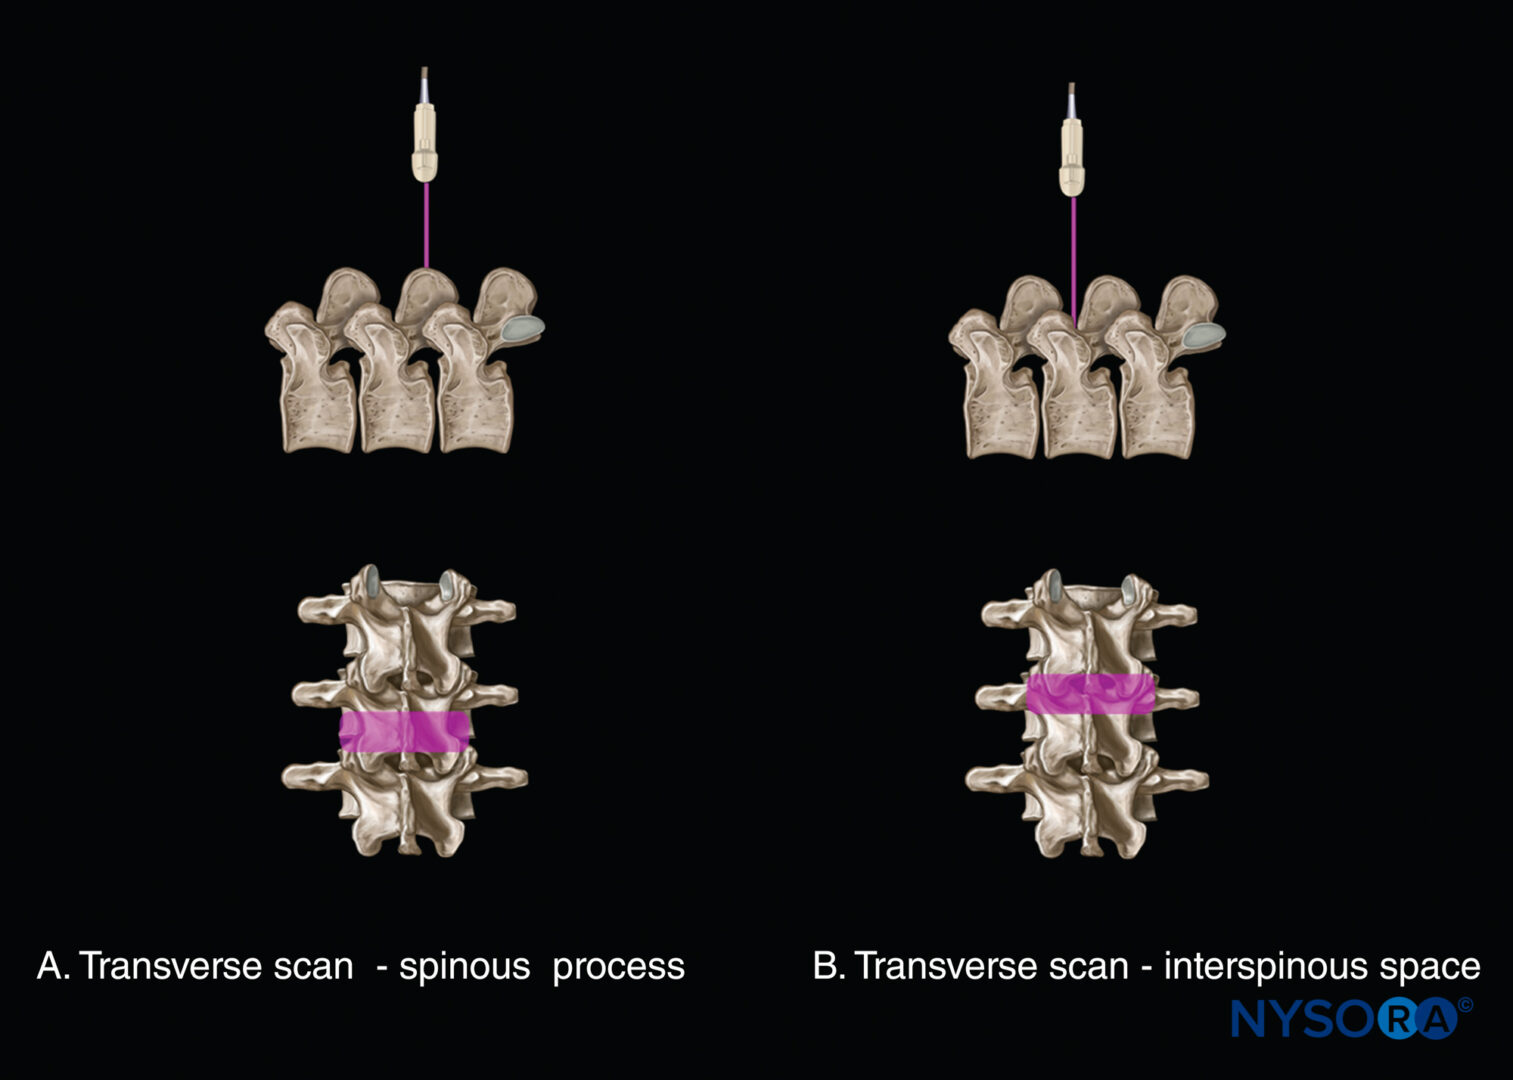
FIGURE 7. Axis of scan: transverse scan (A) at the level of the spinous process; and (B) at the level of the interspinous space.
A sagittal scan can be performed through the midline (median sagittal spinous process view) or through a paramedian plane (Figure 8). Overall, three paramedian sagittal views of the spine can be obtained (from medial to lateral): (1) a paramedian sagittal lamina view (see Figure 8a); (2) a paramedian sagittal articular process view (see Figure 8b); and (3) a paramedian sagittal transverse process view (see Figure 8c). Grau et al. have suggested using a paramedian sagittal scan to visualize the neuraxial structures. We have found that the US visibility of neuraxial structures can be further improved when the spine is imaged in the paramedian sagittal oblique plane (Figure 9). During a paramedian sagittal oblique scan (PMSOS), the transducer is positioned 2–3 cm lateral to the midline (paramedian) and over the laminae in the sagittal axis, tilted slightly medially toward the midline (see Figure 9). The purpose of the medial tilt is to ensure that the US signal enters the spinal canal through the widest part of the interlaminar space and not the lateral sulcus of the spinal canal.
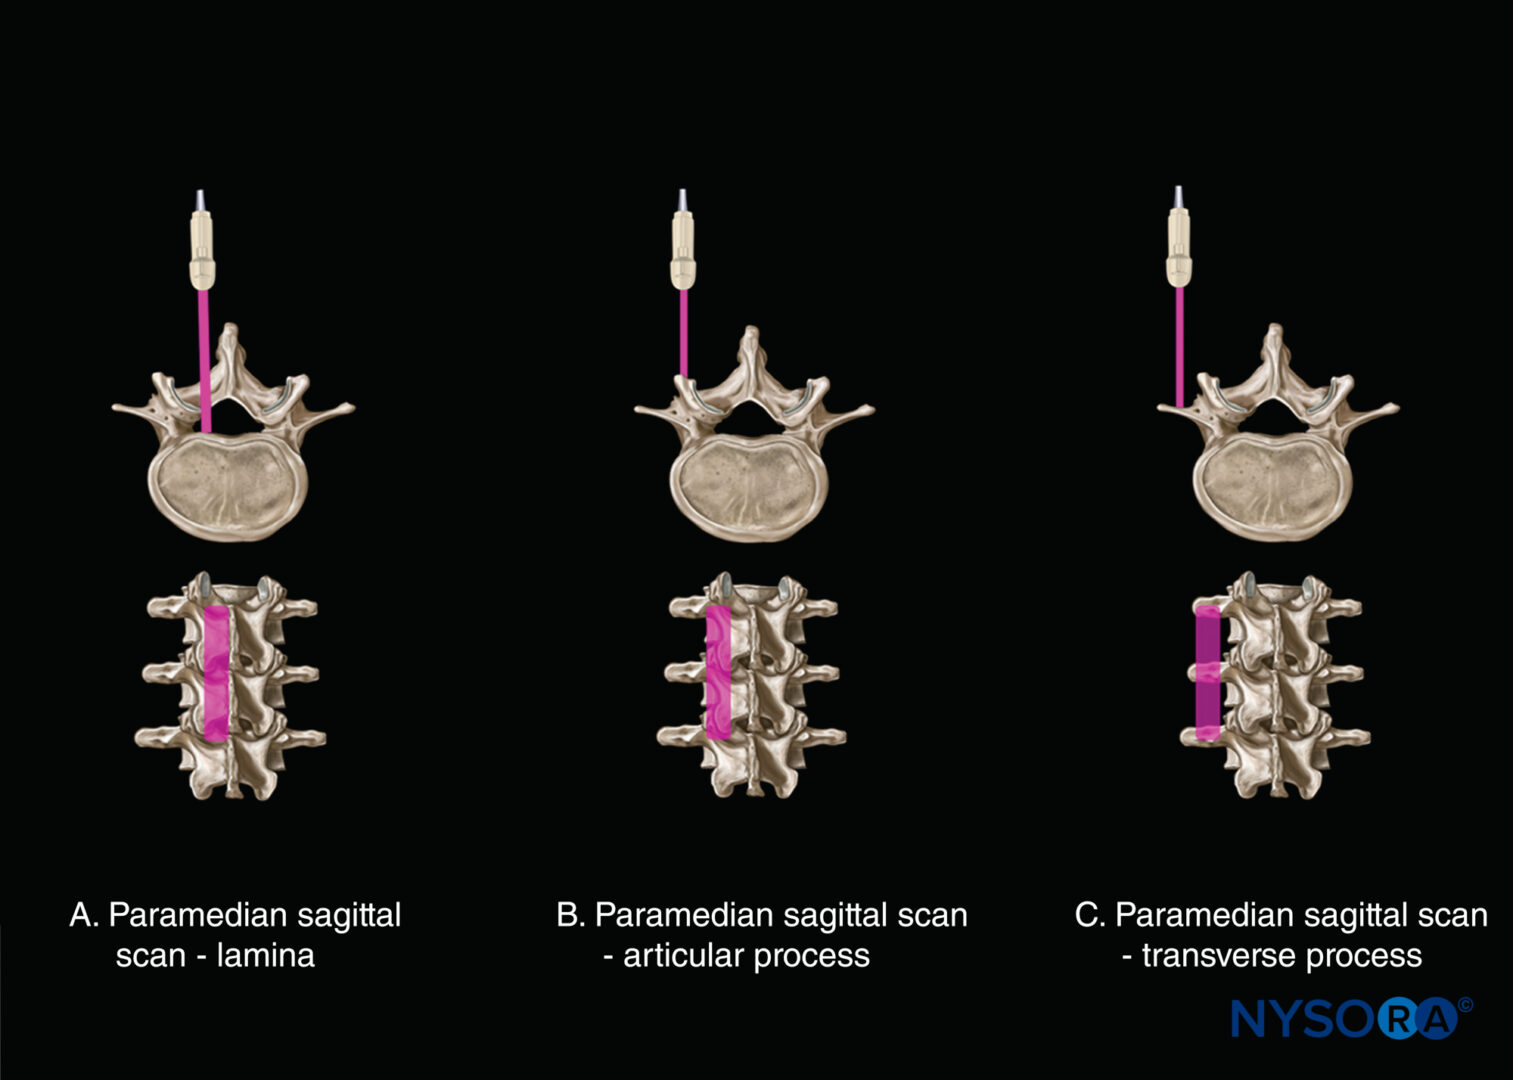
FIGURE 8. Axis of scan: paramedian sagittal scan (A) at the level of the lamina; (B) at the level of the articular process; and (C) at the level of the transverse process.
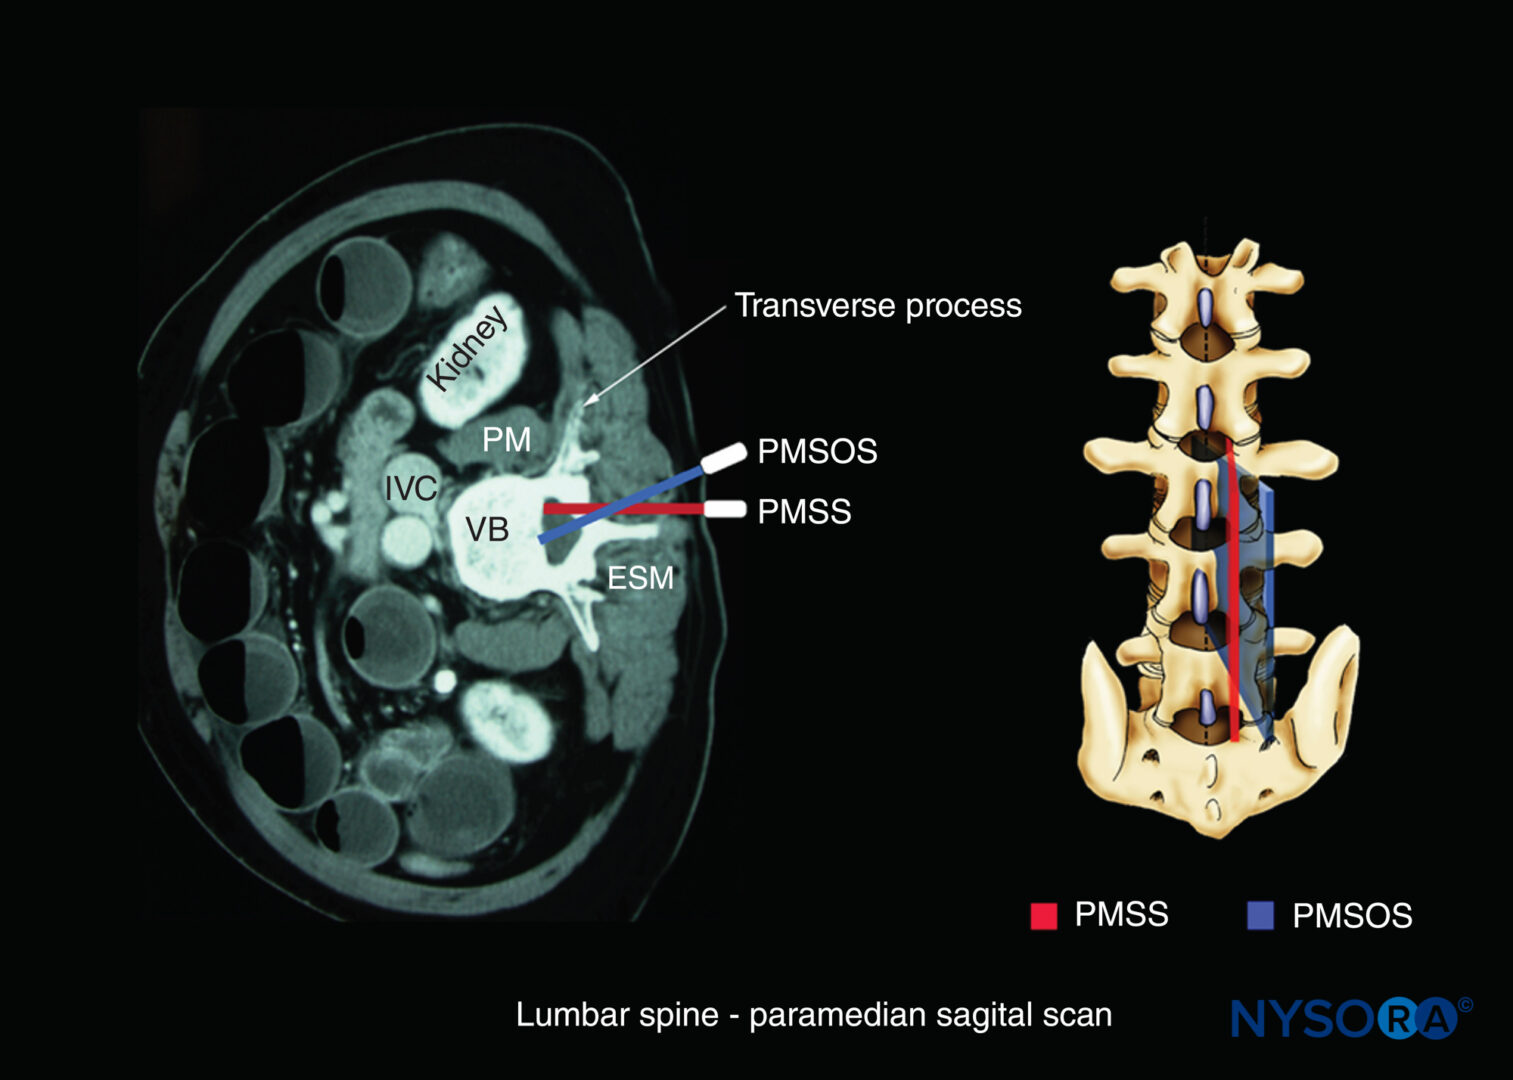
FIGURE 9. Axis of scan: paramedian sagittal oblique scan of the lumbar spine. Note the medial direction of the US beam (blue). ESM, erector spinae muscle; IVC, inferior vena cava; PM, psoas major muscle; PMSOS, paramedian sagittal oblique scan; PMSS, paramedian sagittal scan (red); VB, vertebral body.
Sonoanatomy of the Spine
Detailed knowledge of the vertebral anatomy is essential to understand the sonoanatomy of the spine. Unfortunately, cross-sectional anatomy texts describe the anatomy of the spine in traditional orthogonal planes; that is, the transverse, sagittal, and coronal planes. This often results in difficulty interpreting the spinal sonoanatomy because US imaging is generally performed in an arbitrary or intermediary plane by tilting, sliding, and rotating the transducer. Several anatomical models have recently been developed to teach musculoskeletal US imaging techniques (in human volunteers), the sonoanatomy relevant for peripheral nerve blocks (in human volunteers and cadavers), and the required interventional skills (in tissue-mimicking phantoms and fresh cadavers).
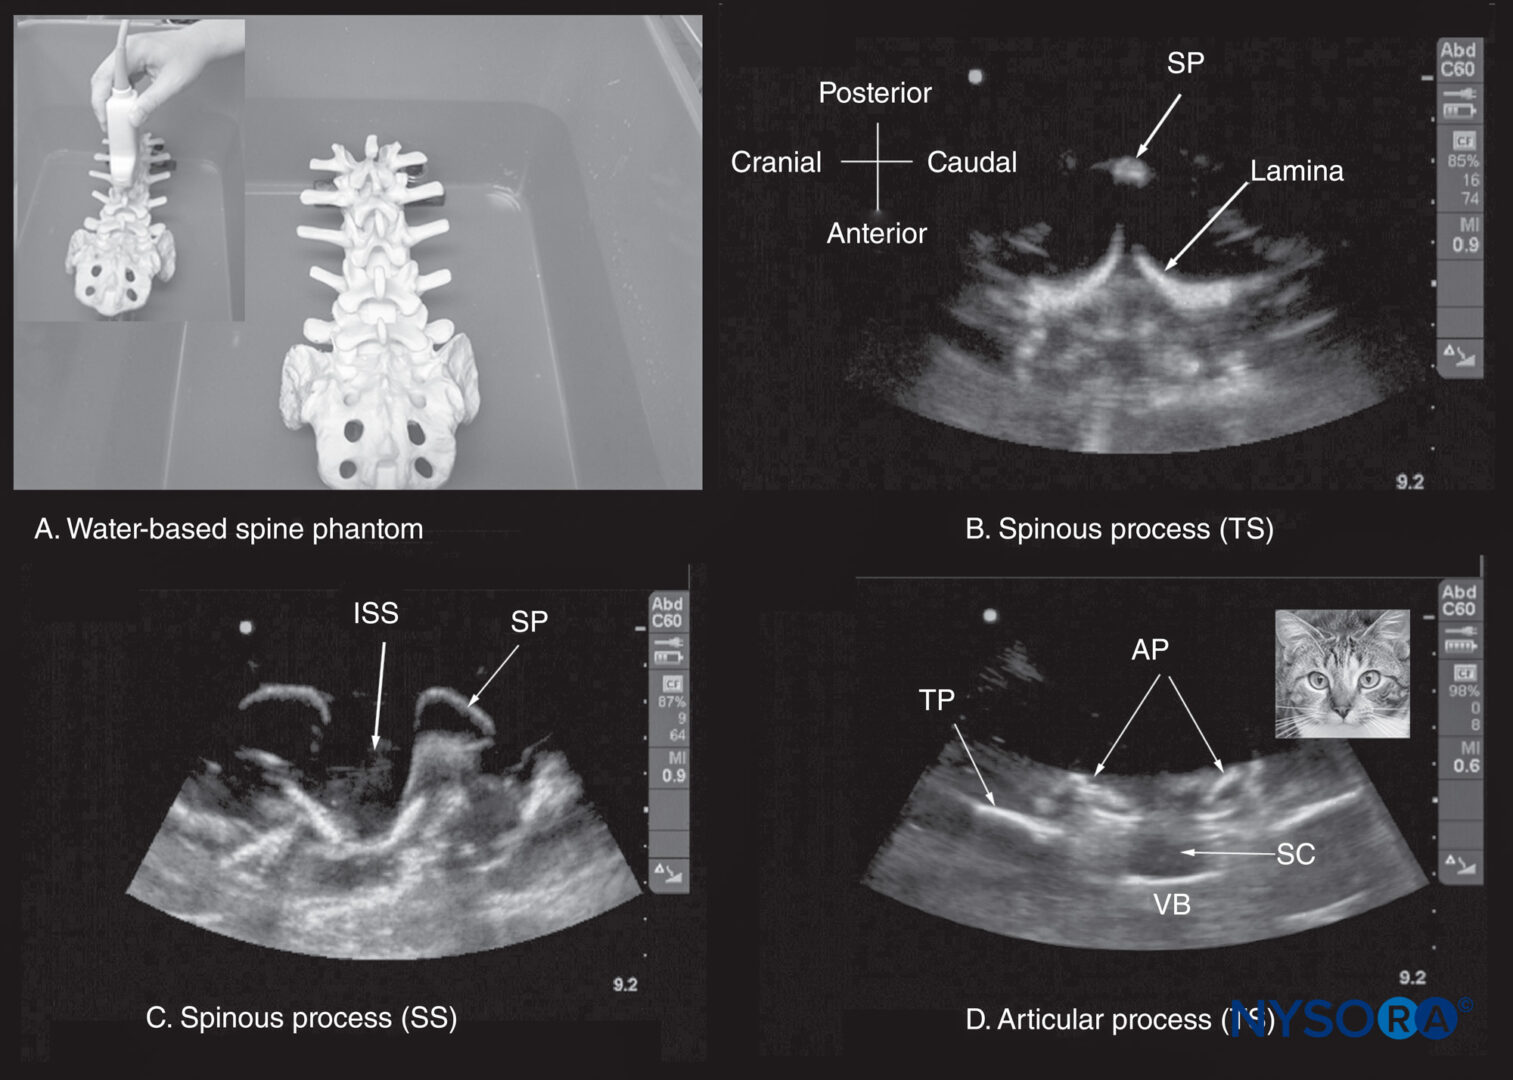
FIGURE 10. (A) The water-based spine phantom. The lumbosacral spine is immersed in a water bath and imaged through the water using a curved linear transducer. The other images are sonograms from the water-based lumbosacral spine phantom showing (B) the transverse spinous process (SP) view; (C) the median sagittal spinous process view; and (D) the transverse interspinous view. An inset image has been placed next to figure (d) to illustrate the resemblance of the sonographic appearance of the transverse interspinous view to a cat’s head; hence, this is referred to as the “cat’s head sign.” AP, articular process; ISS, interspinous space; SC, spinal canal; SP, spinous process; SS, sagittal scan; TP, transverse process; TS, transverse scan; VB, vertebral body.
However, few models or tools are available to learn and practice spinal sonoanatomy or the interventional skills required for USG CNB. Karmakar and colleagues recently described the use of a “water-based spine phantom” (Figure 10) to study the osseous anatomy of the lumbosacral spine. A gelatin lumbosacral spine phantom, gelatin–agar spine phantom (Figure 11), “pig-carcass phantom” (Figure 12), and lumbar training phantom (Figure 13a; CIRS model 034, CIRS, Inc., Norfolk, VA) have also been described to practice the basic hand-eye coordination skills required to perform USG CNBs. Since three-dimensional (3D) reconstructions of high-definition CT scan data (3D volume datasets) can also be used to study the osseous anatomy (Figure 13b, c, d) and validate the structure visualized in multiplanar 3D images (Figure 14). Computer-generated anatomical reconstructions from the Visible Human Project dataset that correspond to the US scan planes provide another useful way of studying the sonoanatomy of the spine in vivo (Figure 15). Multiplanar 3D reconstructions from archived high-resolution 3D CT datasets of the spine can also be used to study and validate the sonographic appearance of the various osseous elements and neuraxial structures of the spine.
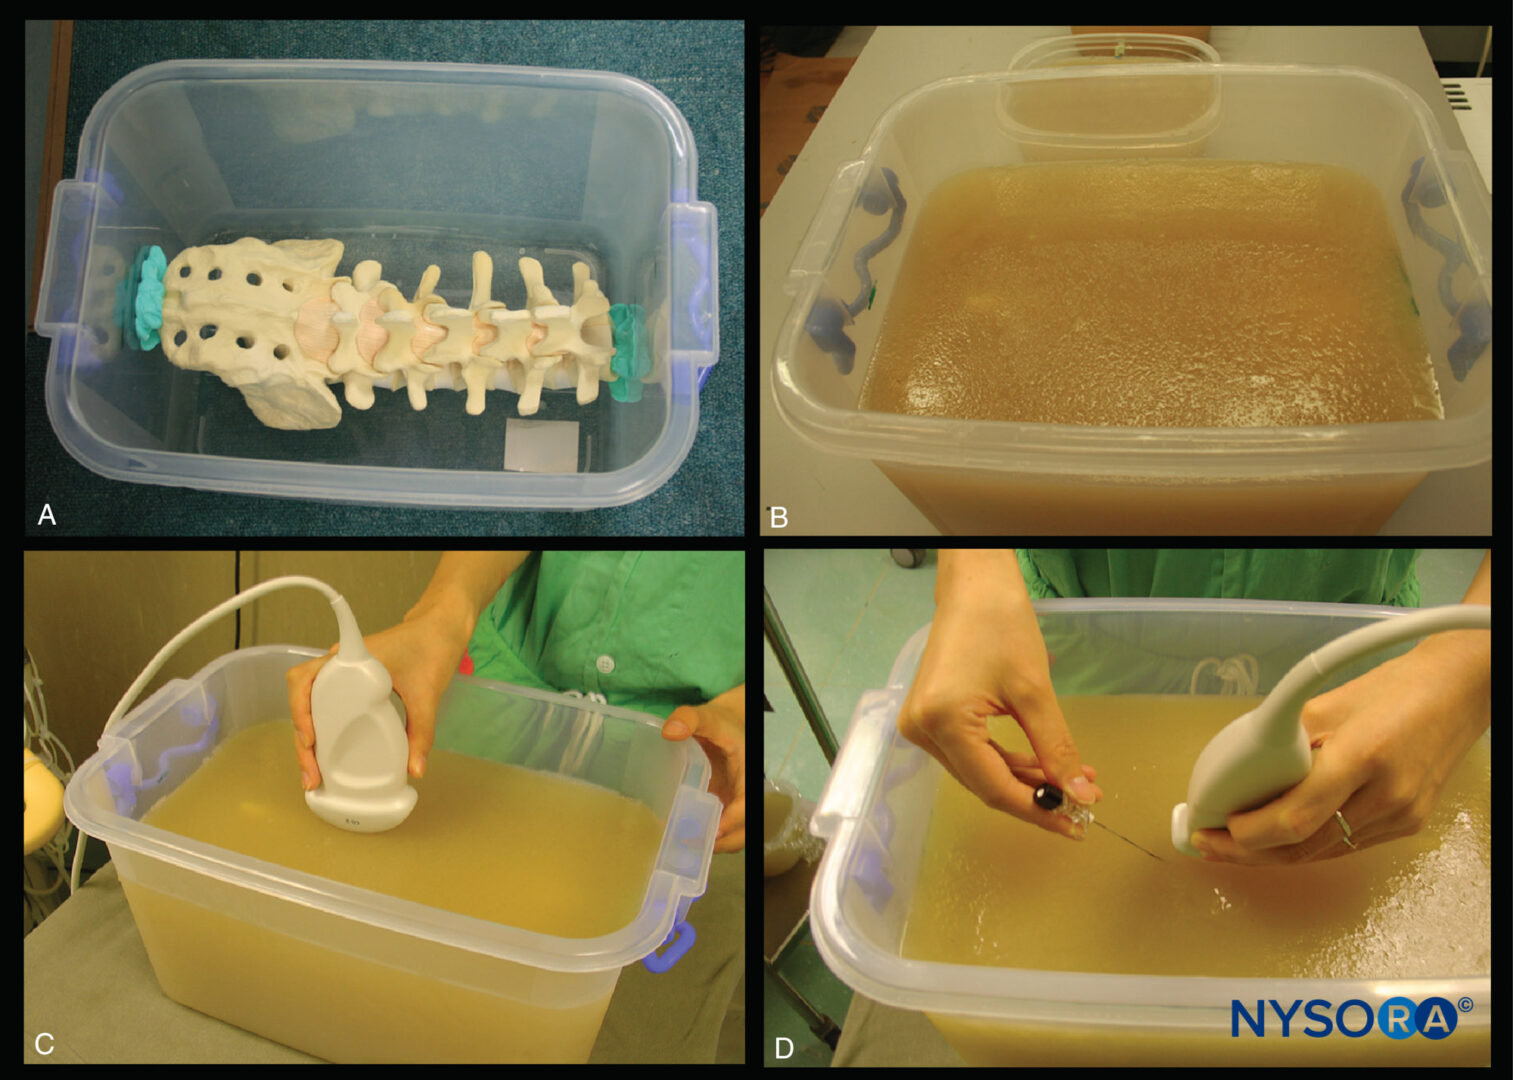
FIGURE 11. Gelatin–agar spine phantom. (A) Lumbosacral spine model secured to the base of the plastic box. (B) Spine phantom after being embedded in the gelatin–agar mixture. (C) Performing a US scan of the gelatin–agar spine phantom. (D) Simulated in-plane needle insertion in the gelatin–agar spine phantom.
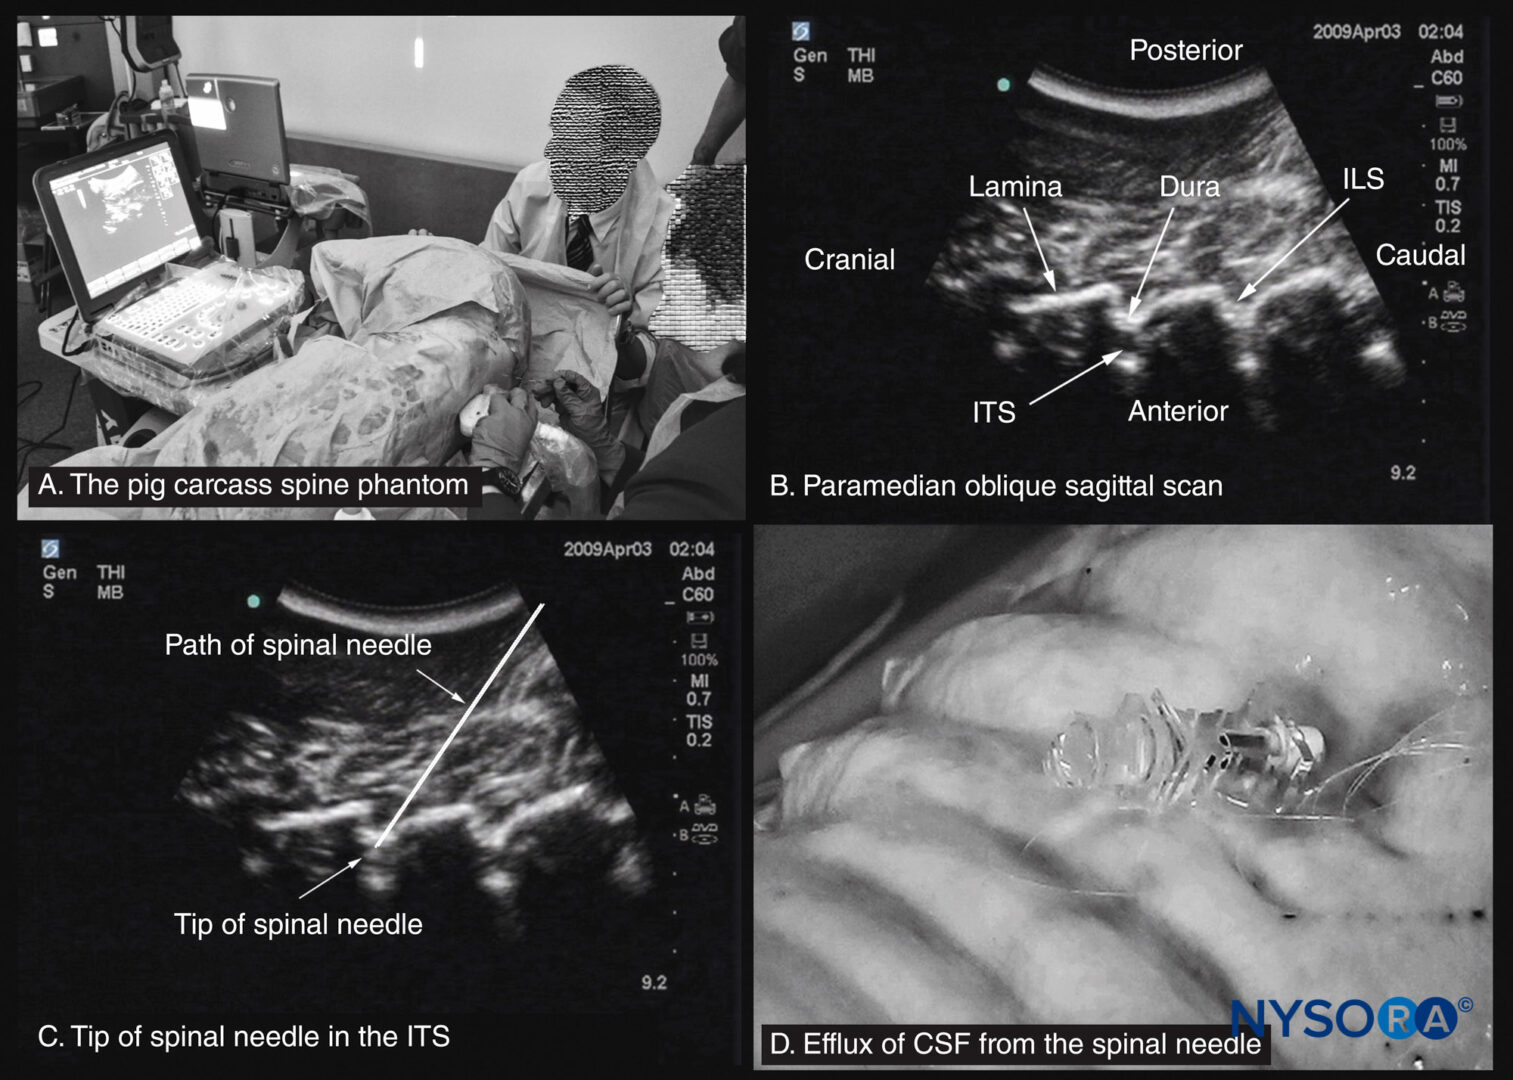
FIGURE 12. The pig carcass spine phantom. (A) Pig carcass spine phantom being used to practice central neuraxial blocks at a workshop. (B) Paramedian sagittal oblique sonogram of the lumbar spine. (C) Sonogram showing the tip of a spinal needle in the intrathecal space (ITS). (D) Efflux of cerebrospinal fluid (CSF) from the hub of a spinal needle that has been inserted into the ITS. ILS, interlaminar space.
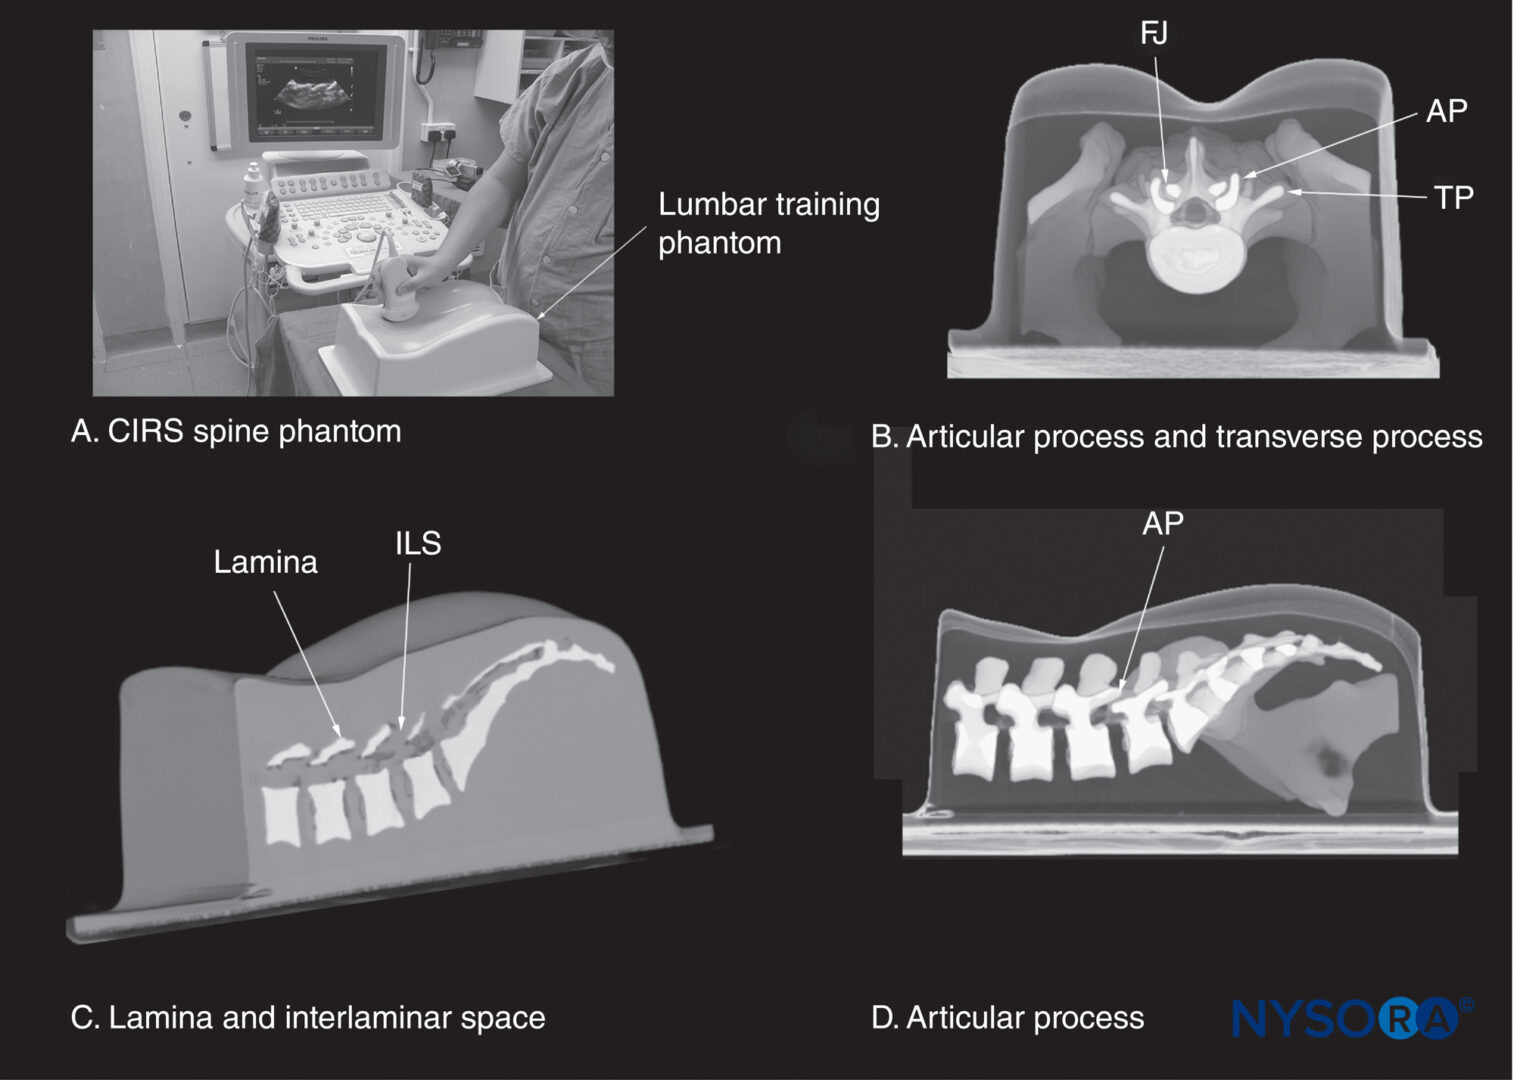
FIGURE 13. (A) CIRS lumbar training phantom (CIRS model 034, CIRS Inc., Norfolk, VA). The other images illustrate a three-dimensional reconstruction of a high-resolution computed tomography scan dataset from the CIRS phantom showing (B) a median transverse interspinous section of the lumbar spine; (C) a paramedian sagittal section at the level of the lamina; and (D) a paramedian sagittal section at the level of the articular processes (AP). FJ, facet joint; ILS, interlaminar space; TP, transverse process.
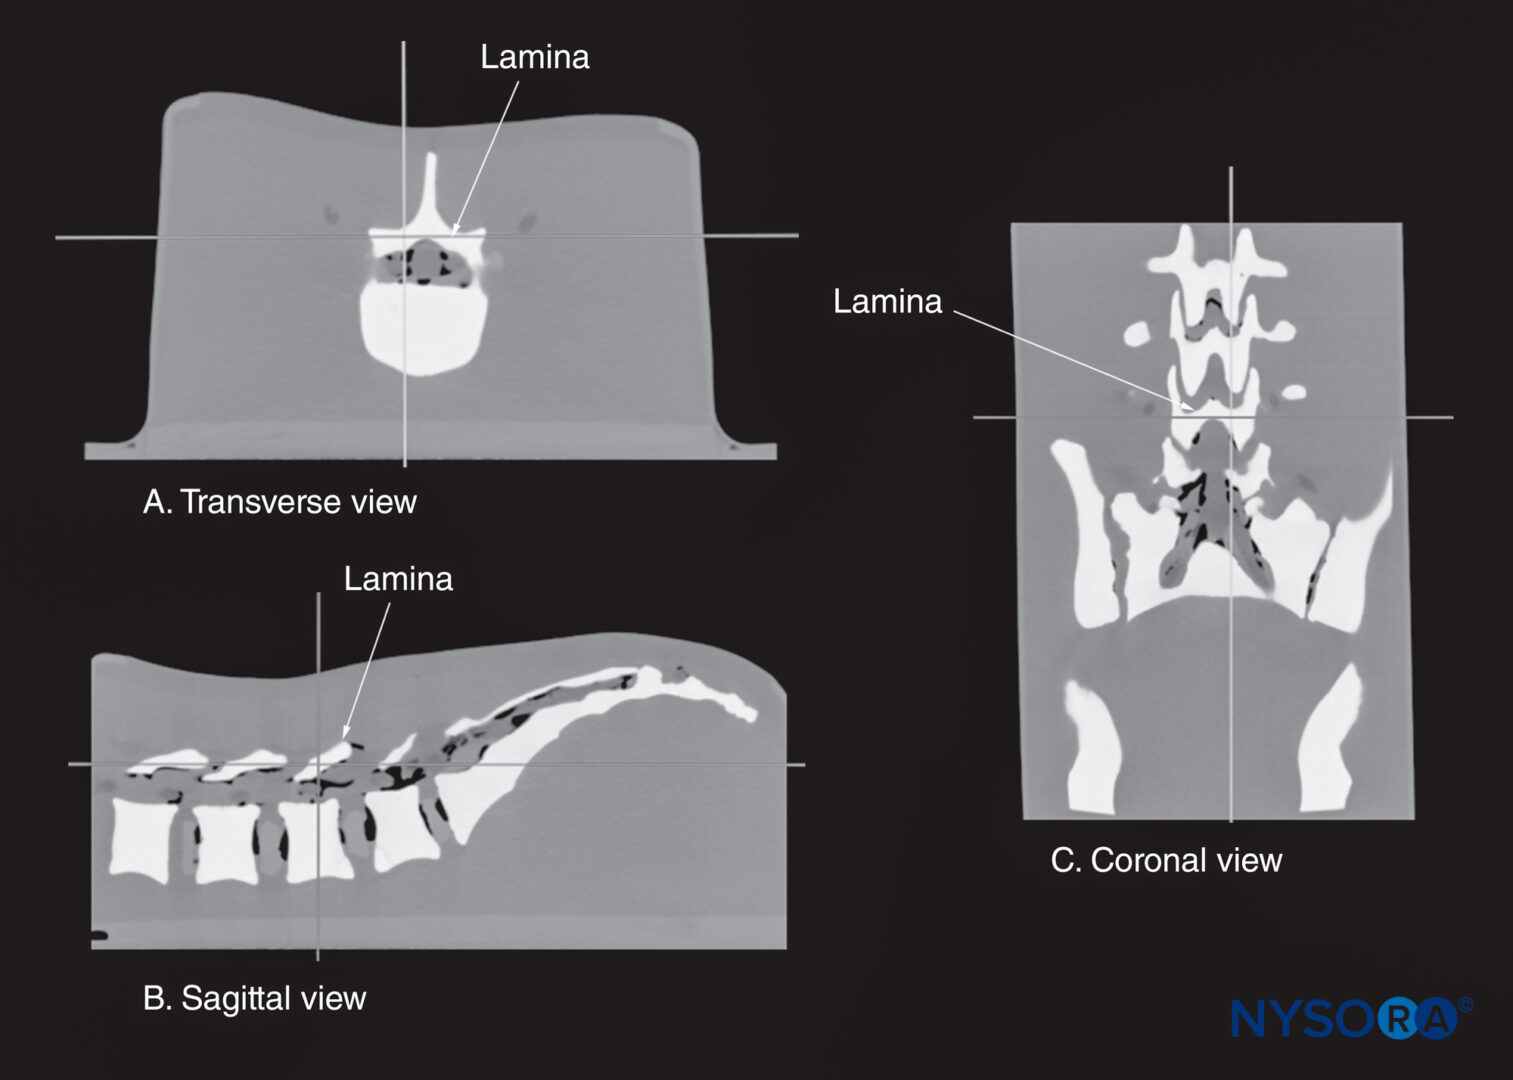
FIGURE 14. Multiplanar three-dimensional reconstruction of a high-resolution computed tomography scan dataset from the CIRS phantom. Note that the reference point (where the two orthogonal planes cross) is lying over the lamina. (A) Transverse view of the lamina. (B) Sagittal view of the lamina. (C) Coronal view of the lamina.
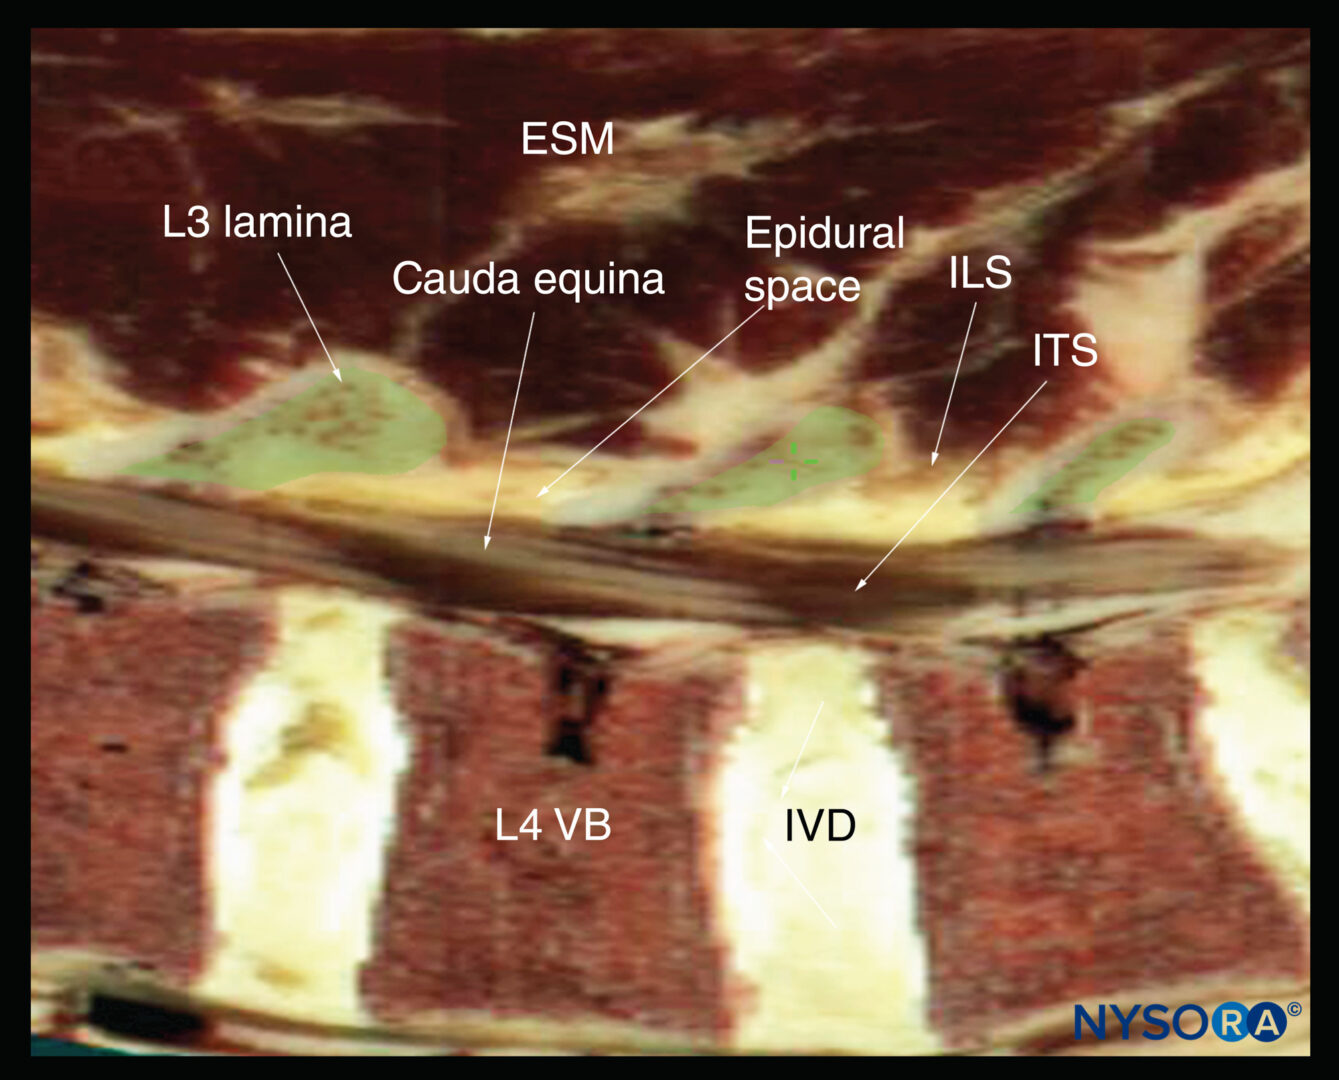
FIGURE 15. Sagittal cadaver anatomical section of the lumbar spine through the lamina of the lumbar spine, rendered from the Visible Human Server male dataset. ESM, erector spinae muscle; ILS, interlaminar space; ITS, intrathecal space; IVD, intervertebral disc; VB, vertebral body.
Water-Based Spine Phantom
The water-based spine phantom simplifies the process of learning the sonoanatomy of the spine in two easy steps: (1) learning the sonoanatomy of the osseous elements of the spine; and (2) learning the sonoanatomy of the soft-tissue structures that make up the spine. The water-based spine phantom is an excellent model to define the osseous anatomy of the spine and is based on a model described previously by Greher and colleagues to study the osseous anatomy of relevance to USG lumbar facet nerve block. The model is prepared by immersing a commercially available lumbosacral spine model in a water bath (see Figure 10a). A low-frequency curved array transducer is then used to scan the model through the water in the transverse and sagittal axes as one would do in vivo. Each osseous element of the spine produces a characteristic sonographic pattern. The ability to recognize these sonographic patterns is an important step toward understanding the sonoanatomy of the spine.
Representative US images of the spinous process, lamina, articular processes, and transverse process from the water-based spine phantom are presented in Figures 10b, c, d and 16a, b, c. The advantage of this waterbased spine phantom is that water produces an anechoic (black) background against which the hyperechoic reflections from the bone are clearly visualized. The water-based spine phantom allows a see-through, real-time visual validation of the sonographic appearance of a given osseous element by performing the scan with a marker (eg, a needle) in contact with it (see Figure 16a). The described model is also inexpensive, easily prepared, requires little time to set up, and can be used repeatedly without deteriorating or decomposing, as animal tissuebased phantoms do. Once the novice learns to identify the individual osseous elements of the spine in the various US scan planes, it becomes easy to define the gaps between these elements: the interspinous (see Figure 10c) and interlaminar spaces (see Figure 16a), through which the US energy enters the spinal canal to produce the acoustic window seen on a spinal sonogram. The same gaps or spaces also permit passage of the needle to the neuraxis during USG CNB.
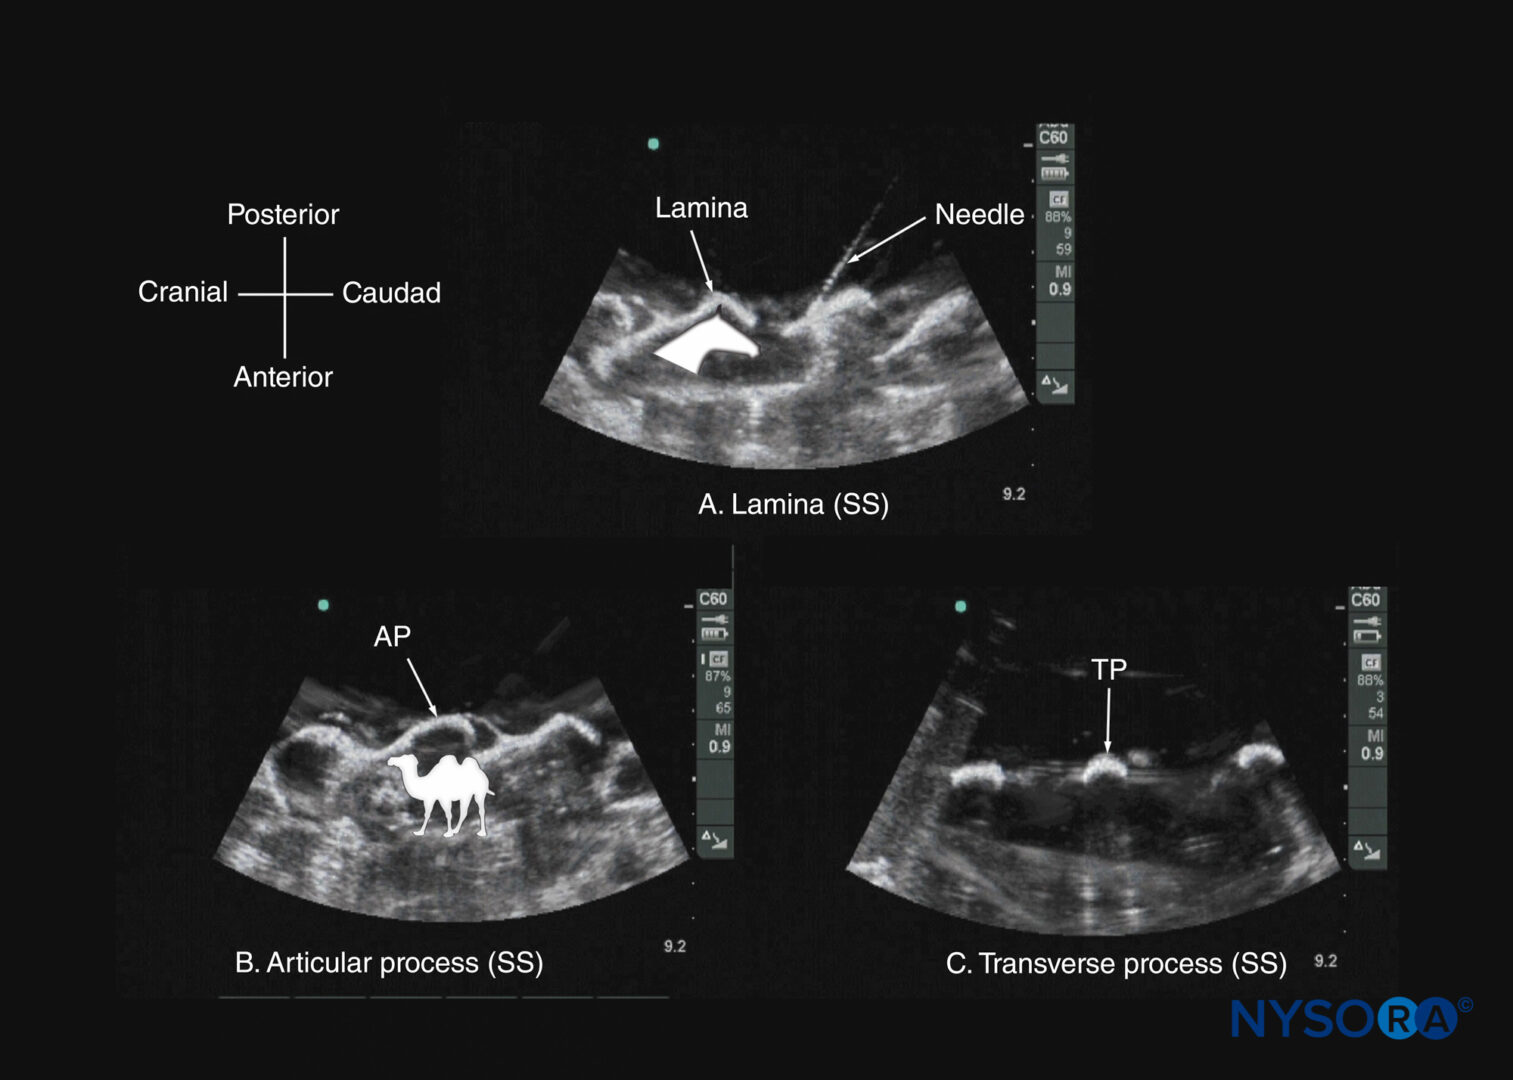
FIGURE 16. Paramedian sagittal sonogram of the (A) lamina; (B) articular process; and (C) transverse process from a water-based spine phantom. Note the needle in contact with the lamina in (a), a method that was used to validate the sonographic appearance of the osseous elements in the phantom. The inset image in (a) illustrates the horse-head–like appearance of the laminae, and the inset image in (b) illustrates the camel-hump–like appearance of the articular processes. AP, articular process; SS, sagittal scan; TP, transverse process.
ULTRASOUND IMAGING OF THE LUMBAR SPINE
Sagittal Scan
The patient is positioned in the sitting, lateral, or prone position, with the lumbosacral spine maximally flexed. The transducer is placed 1–2 cm lateral to the spinous process (ie, in the paramedian sagittal plane) at the lower back with its orientation marker directed cranially. A slight medial tilt during the scan insonates the spine in a paramedian sagittal oblique (PMSO) plane. First, the sacrum is identified as a flat, hyperechoic structure with a large acoustic shadow anteriorly (Figure 17). When the transducer is slid in a cranial direction, a gap is seen between the sacrum and the lamina of the L5 vertebra, which is the L5–S1 interlaminar space, also referred to as the L5– S1 gap (Figures 17 and 18). The L3–4 and L4–5 interlaminar spaces can now be located by counting upward (Figure 19). The erector spinae muscles are hypoechoic and lie superficial to the laminae.
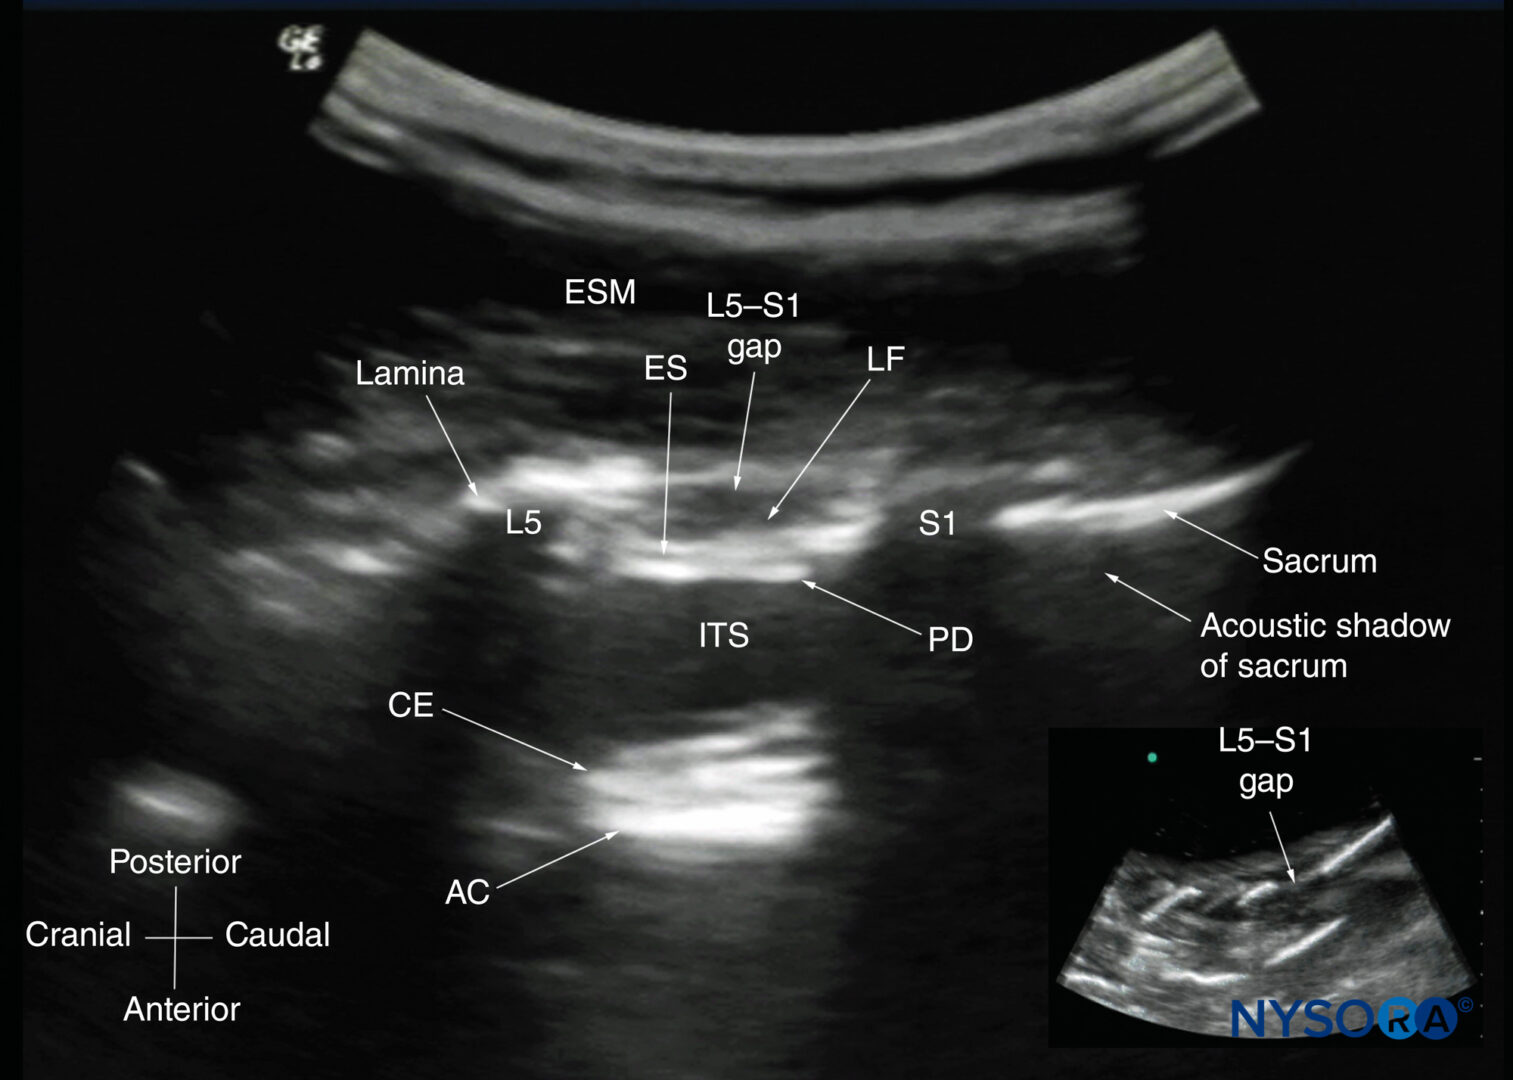
FIGURE 17. Paramedian sagittal sonogram of the lumbosacral junction. The posterior surface of the sacrum is identified as a flat hyperechoic structure with a large acoustic shadow anteriorly. The dip or gap between the sacrum and the lamina of L5 is the L5–S1 intervertebral space, or the L5–S1 gap. The inset image is a matching sonogram from a water-based spine phantom showing the L5–S1 gap. AC, anterior complex; CE, cauda equina; ES, epidural space; ESM, erector spinae muscle; ITS, intrathecal space; LF, ligamentum flavum; PD, posterior dura.
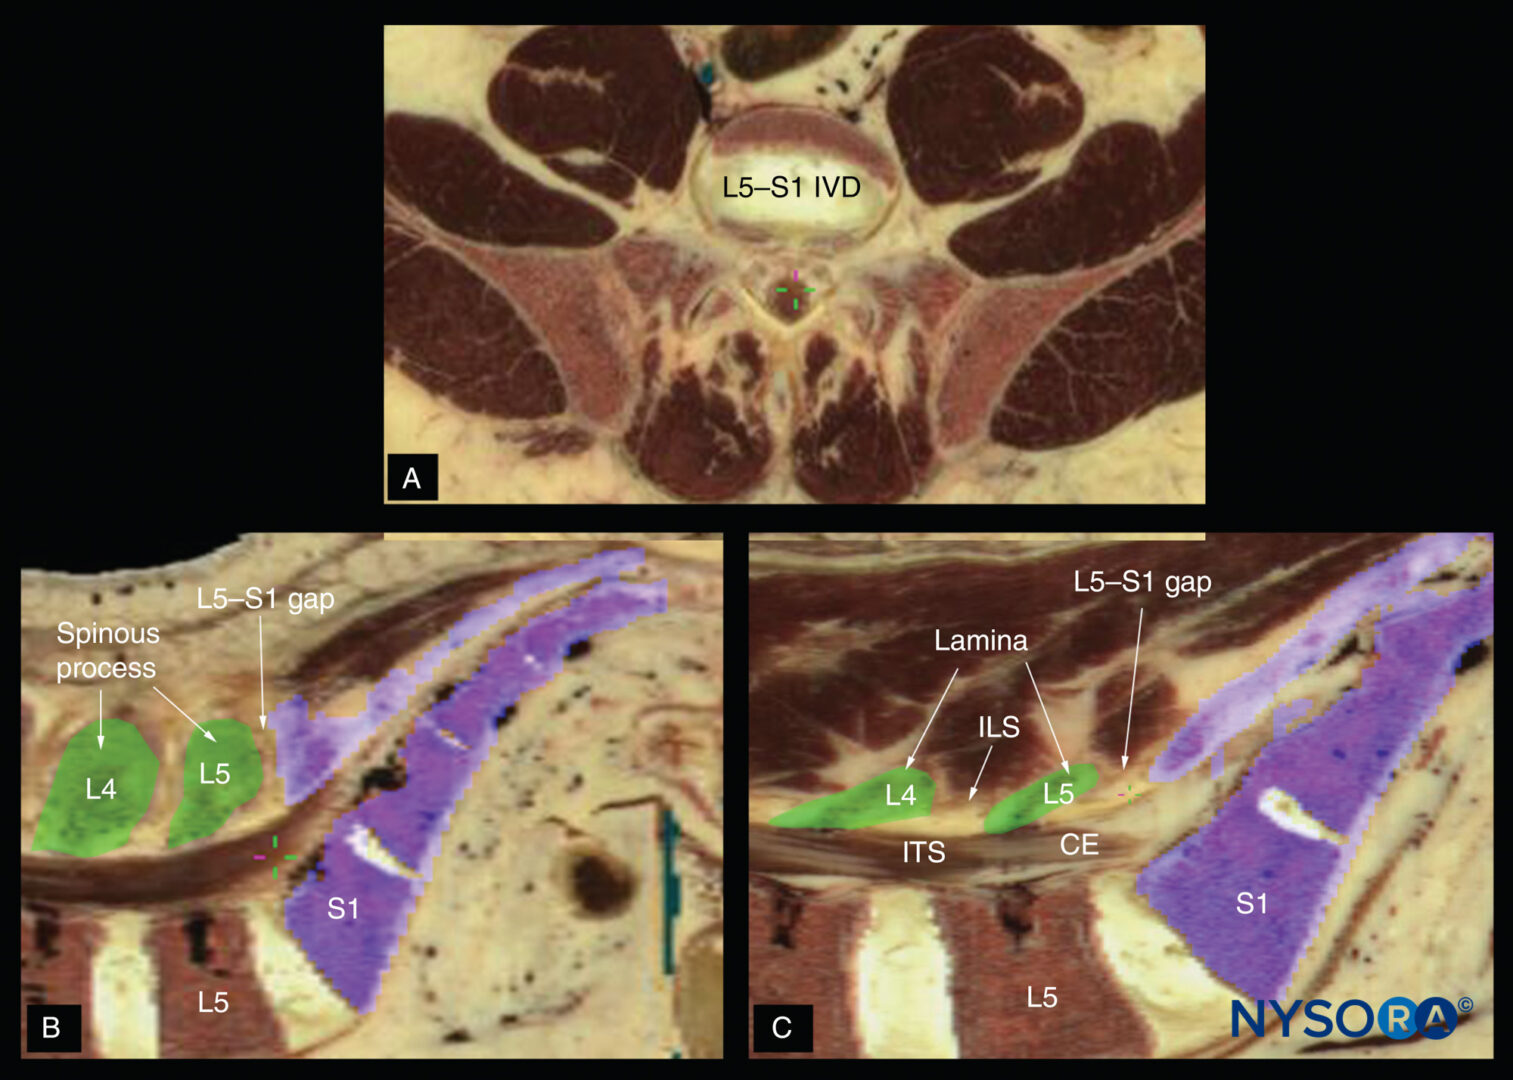
FIGURE 18. Cadaver anatomical section showing the lumbosacral junction (L5–S1 gap) in the (A) transverse axis; (B) median (sagittal) axis and (C) paramedian sagittal axis. CE, cauda equina; ILS, interlaminar space; ITS, intrathecal space; IVD, intervertebral disc.
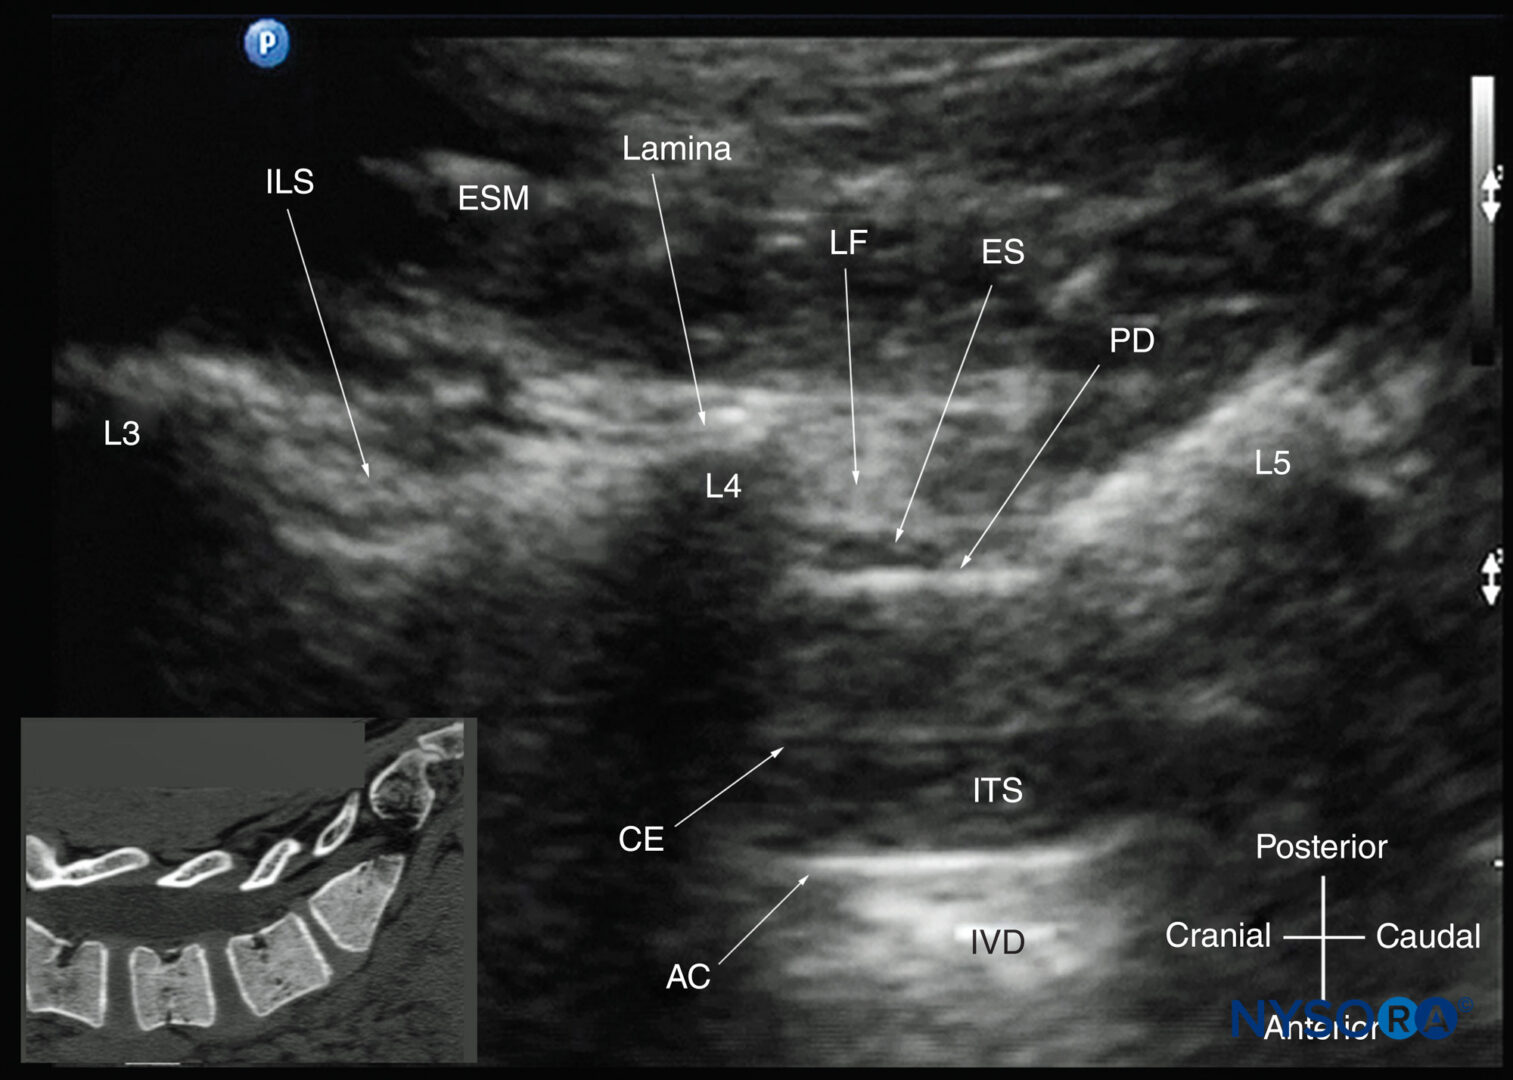
FIGURE 19. Paramedian sagittal oblique sonogram of the lumbar spine at the level of the lamina showing the L3–4 and L4–5 interlaminar spaces. Note the hypoechoic epidural space (a few millimeters wide) between the hyperechoic ligamentum flavum and the posterior dura. The intrathecal space is the anechoic space between the posterior dura and the anterior complex. The cauda equina nerve fibers are also seen as hyperechoic longitudinal structures within the thecal sac. The hyperechoic reflections seen in front of the anterior complex are from the intervertebral disc (IVD). The inset image shows a matching computed tomography (CT) scan of the lumbosacral spine in the same anatomical plane as the US scan. The CT slice was reconstructed from a three-dimensional CT dataset from the author’s archive. AC, anterior complex; CE, cauda equina; ES, epidural space; ESM, erector spinae muscle; ILS, interlaminar space; ITS, intrathecal space; IVD, intervertebral disc; L3, lamina of L3 vertebra; L4, lamina of L4 vertebra; L5, lamina of L5 vertebra; LF, ligamentum flavum; PD, posterior dura.
The lamina appears hyperechoic and is the first osseous structure visualized (see Figure 19). Because bone impedes US penetration, there is an acoustic shadow anterior to each lamina. The sonographic appearance of the lamina produces a pattern that resembles the head and neck of a horse (the “horse head sign”) (see Figures 16a and 19). The interlaminar space is the gap between the adjoining laminae (Figure 20) and is the “acoustic window” through which the neuraxial structures are visualized within the spinal canal.
Three- dimensional (3D) reconstruction of high-resolution computed tomography (CT) scan dataset from the CIRS phantom. (B) Paramedian sagittal oblique sonogram through the L3–5 interlaminar spaces. (C) Paramedian sagittal cadaver anatomic section. AC, anterior complex; ES, epidural space; ILS, interlaminar space; ITS, intrathecal space; IVD, intervertebral disc; LF, ligamentum flavum; PD, posterior dura; VB, vertebral body.")
FIGURE 20. Paramedian sagittal sections of the lumbosacral spine showing the lamina, interlaminar spaces, and spinal canal.(A)Three- dimensional (3D) reconstruction of high-resolution computed tomography (CT) scan dataset from the CIRS phantom. (B) Paramedian sagittal oblique sonogram through the L3–5 interlaminar spaces. (C) Paramedian sagittal cadaver anatomic section. AC, anterior complex; ES, epidural space; ILS, interlaminar space; ITS, intrathecal space; IVD, intervertebral disc; LF, ligamentum flavum; PD, posterior dura; VB, vertebral body.
The ligamentum flavum appears as a hyperechoic band across the adjacent laminae (see Figure 19). The posterior dura is the next hyperechoic structure anterior to the ligamentum flavum, and the epidural space is the hypoechoic area (a few millimeters wide) between the ligamentum flavum and the posterior dura (see Figure 19). The ligamentum flavum and posterior dura may also be seen as a single linear hyperechoic structure, which is referred to as the “posterior complex” or “ligamentum flavum–posterior dura complex.” The posterior dura is generally more hyperechoeic than the ligamentum flavum. The thecal sac with the cerebrospinal fluid is the anechoic space anterior to the posterior dura (see Figure 19). The cauda equina, which is located within the thecal sac, is often seen as multiple horizontal, hyperechoic shadows within the anechoic thecal sac. Pulsations of the cauda equina are identified in some patients. The anterior dura is also hyperechoic, but it is not always easy to differentiate it from the posterior longitudinal ligament and the posterior surface of the vertebral body because they are of similar echogenicity (isoechoic) and closely apposed to each other. What results is a single, composite, hyperechoic reflection anteriorly, which is referred to as the “anterior complex” (see Figures 17 and 19).
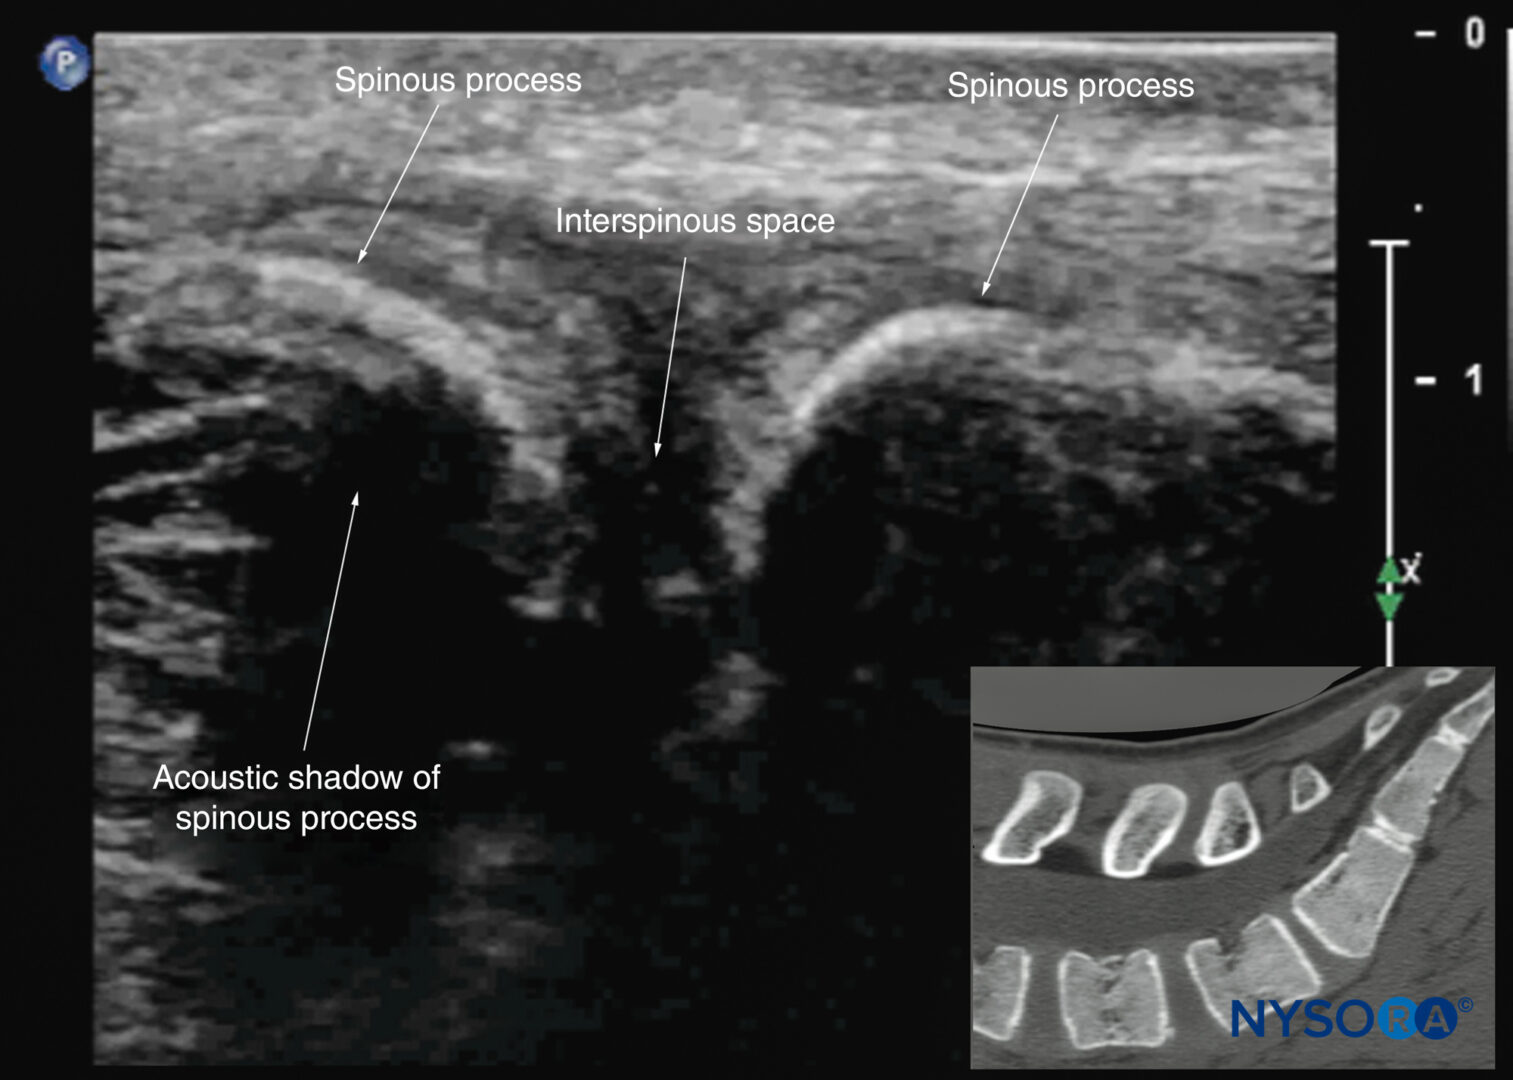
FIGURE 21. Median sagittal sonogram of the lumbar spine showing the crescent-shaped hyperechoic reflections of the spinous processes. Note the narrow interspinous space in the midline. The inset image shows a corresponding computed tomography (CT) scan of the lumbosacral spine through the median plane. The CT slice was reconstructed from a three-dimensional CT dataset from the author’s archive.
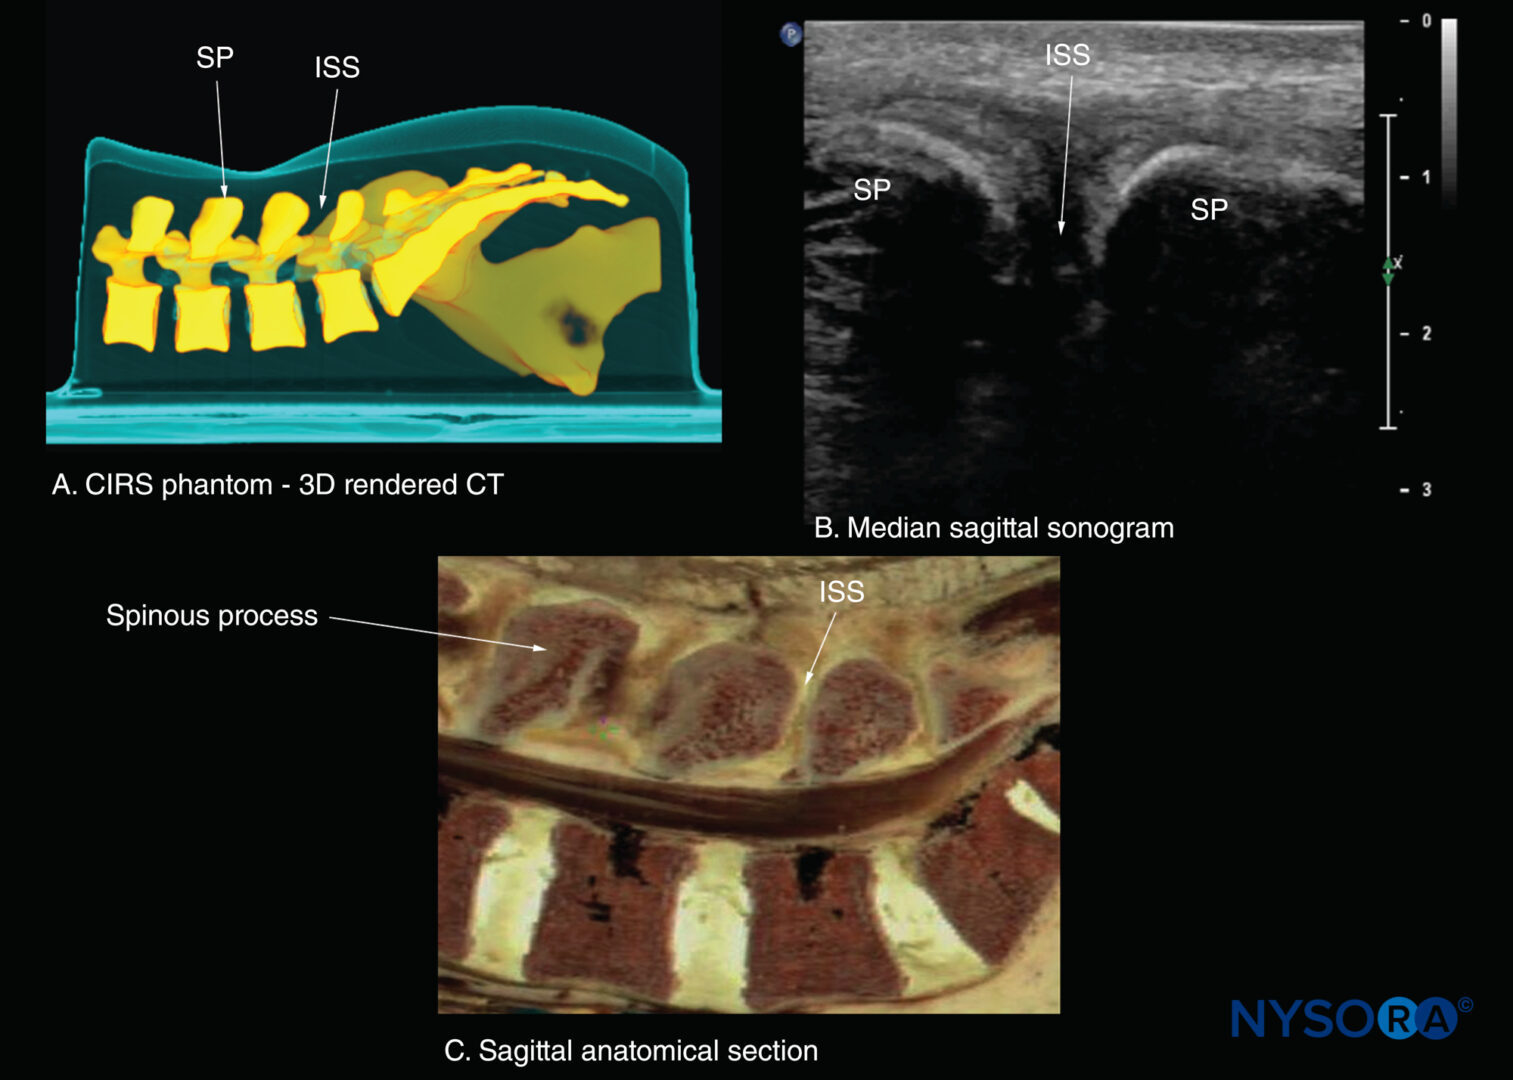
FIGURE 22. Median sagittal sections of the lumbosacral spine. (A) Three-dimensional (3D) reconstruction of high-resolution computed tomography (CT) scan dataset from the CIRS phantom. (B) Median sagittal sonogram showing the spinous process (SP) and interspinous space (ISS). (C) Median sagittal cadaver anatomical section.
If the transducer slides medially, that is, to the median sagittal plane, the median sagittal spinous process view is obtained, and the tips of the spinous processes of the L3–L5 vertebrae, which appear as superficial, hyperechoic crescent-shaped structures, are seen (Figures 10c, 21, and 22). The acoustic window between the spinous processes in the median plane is narrow and often prevents clear visualization of the neuraxial structures within the spinal canal. If the transducer is moved laterally from the paramedian sagittal plane at the level of the lamina, the paramedian sagittal articular process view (Figures 23 and 24) is seen. The articular processes of the vertebrae appear as one continuous, hyperechoic wavy line with no intervening gaps (see Figure 23).
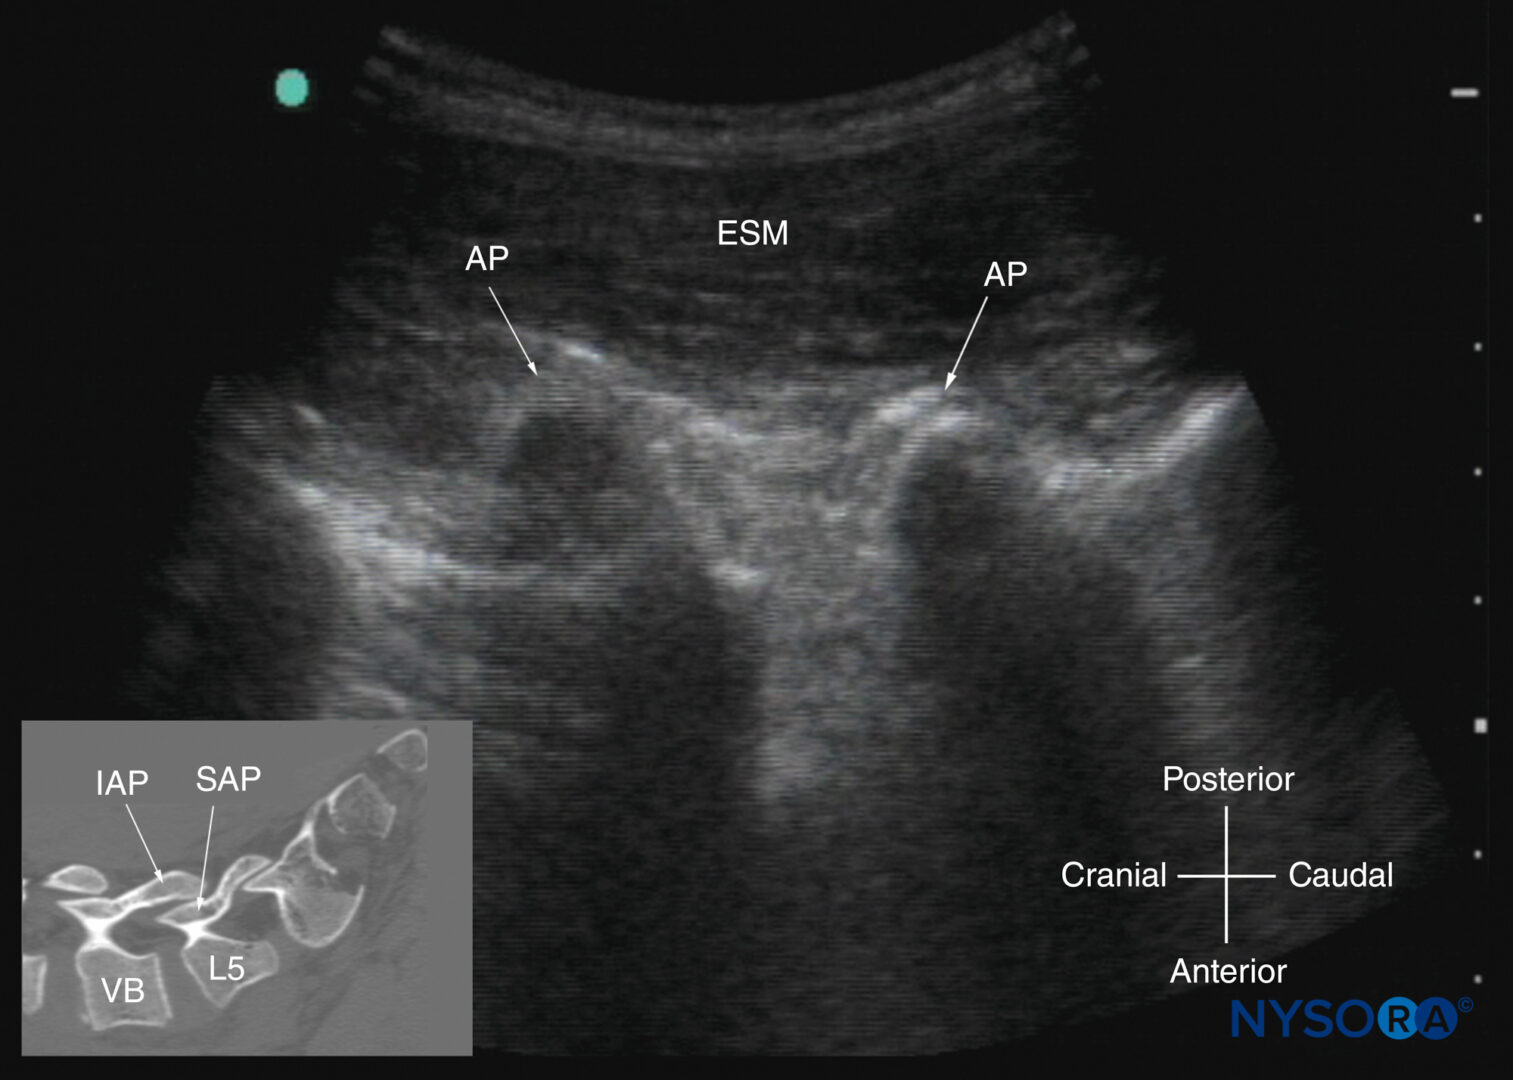
FIGURE 23. Paramedian sagittal sonogram of the lumbar spine at the level of the articular processes (APs) of the vertebrae. Note the “camel hump” appearance of the APs. The inset image shows a corresponding computed tomography (CT) scan of the lumbosacral spine at the level of the APs. The CT slice was reconstructed from a three-dimensional CT dataset from the author’s archive. ESM, erector spinae muscle; IAP, inferior articular process; SAP, superior articular process; VB, vertebral body
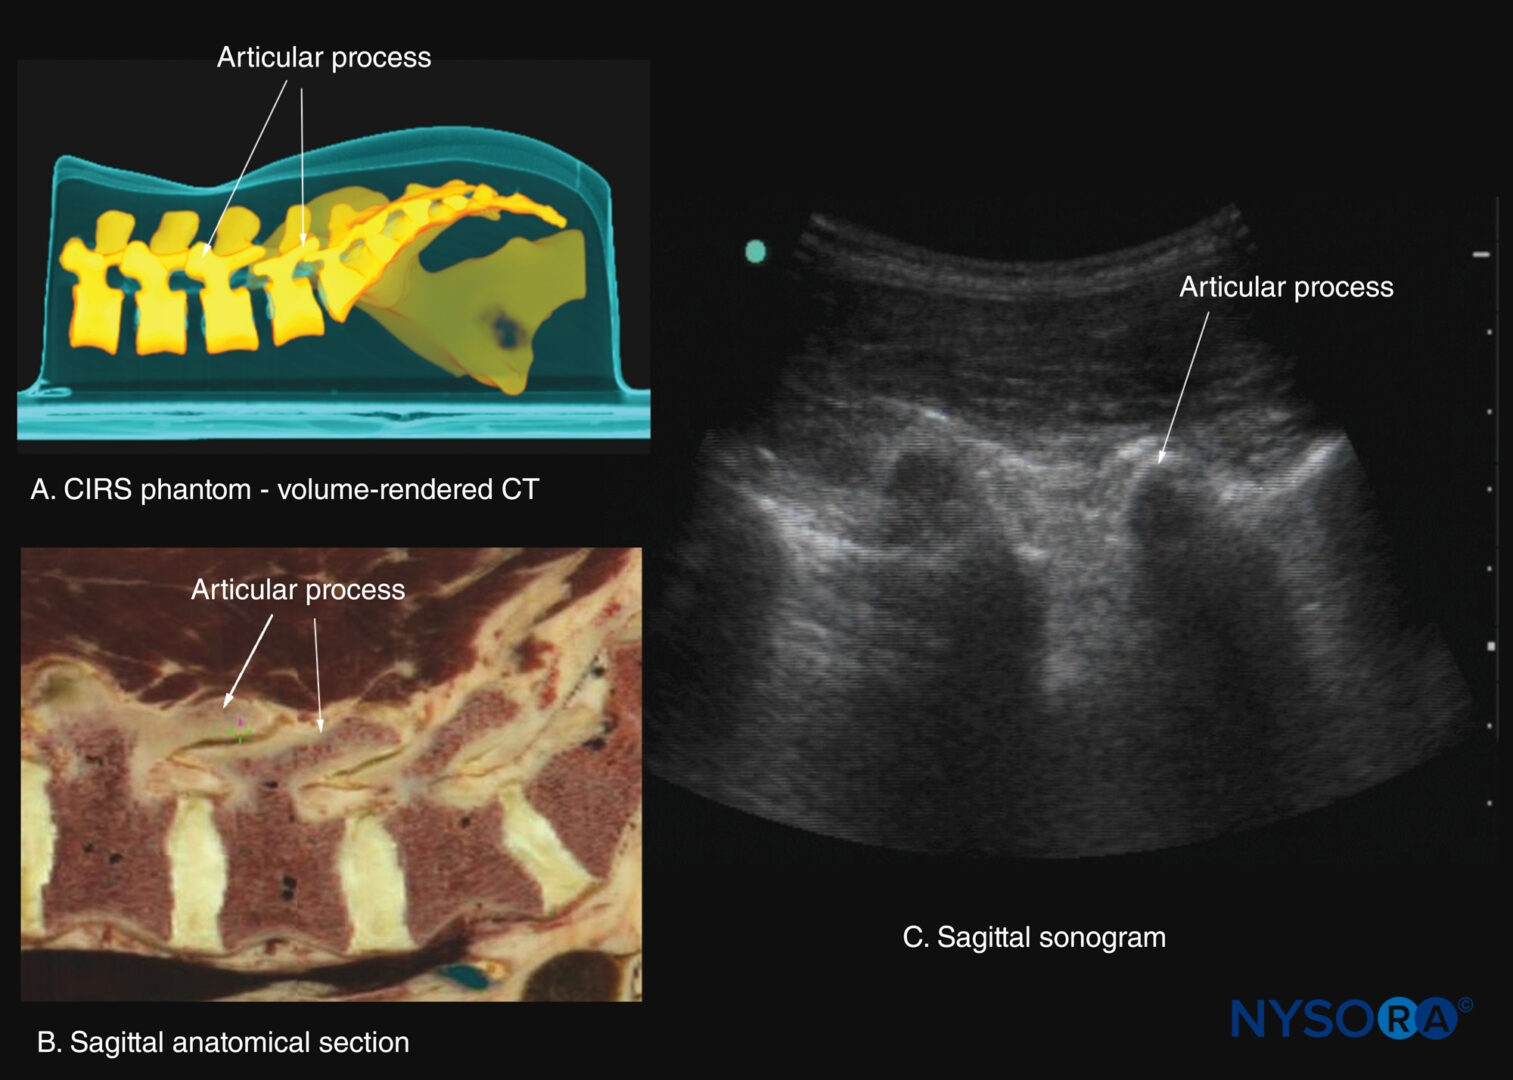
FIGURE 24. Paramedian sagittal sections of the lumbar spine at the level of the articular processes (APs). (A) Three-dimensional reconstruction of a high-resolution computed tomography (CT) scan dataset from the CIRS phantom. (B) Paramedian sagittal cadaver anatomical section. (C) Paramedian sagittal sonogram.
This produces a sonographic pattern that resembles multiple camel humps, which is therefore referred to as the “camel hump sign” (see Figures 16b, 23, and 24). A sagittal scan lateral to the articular processes brings the transverse processes of the L3–L5 vertebrae into view and produces the paramedian sagittal transverse process view (Figures 25 and 26). The transverse processes are recognized by their crescent-shaped, hyperechoic reflections and finger-like acoustic shadows anteriorly (see Figures 16c, 25, and 26). These characteristics produce a sonographic pattern that is referred to as the “trident sign” because of its resemblance to the trident (Latin tridens or tridentis) that is often associated with Poseidon, the god of the sea in Greek mythology, and the trishula of the Hindu god Shiva (Figure 25).
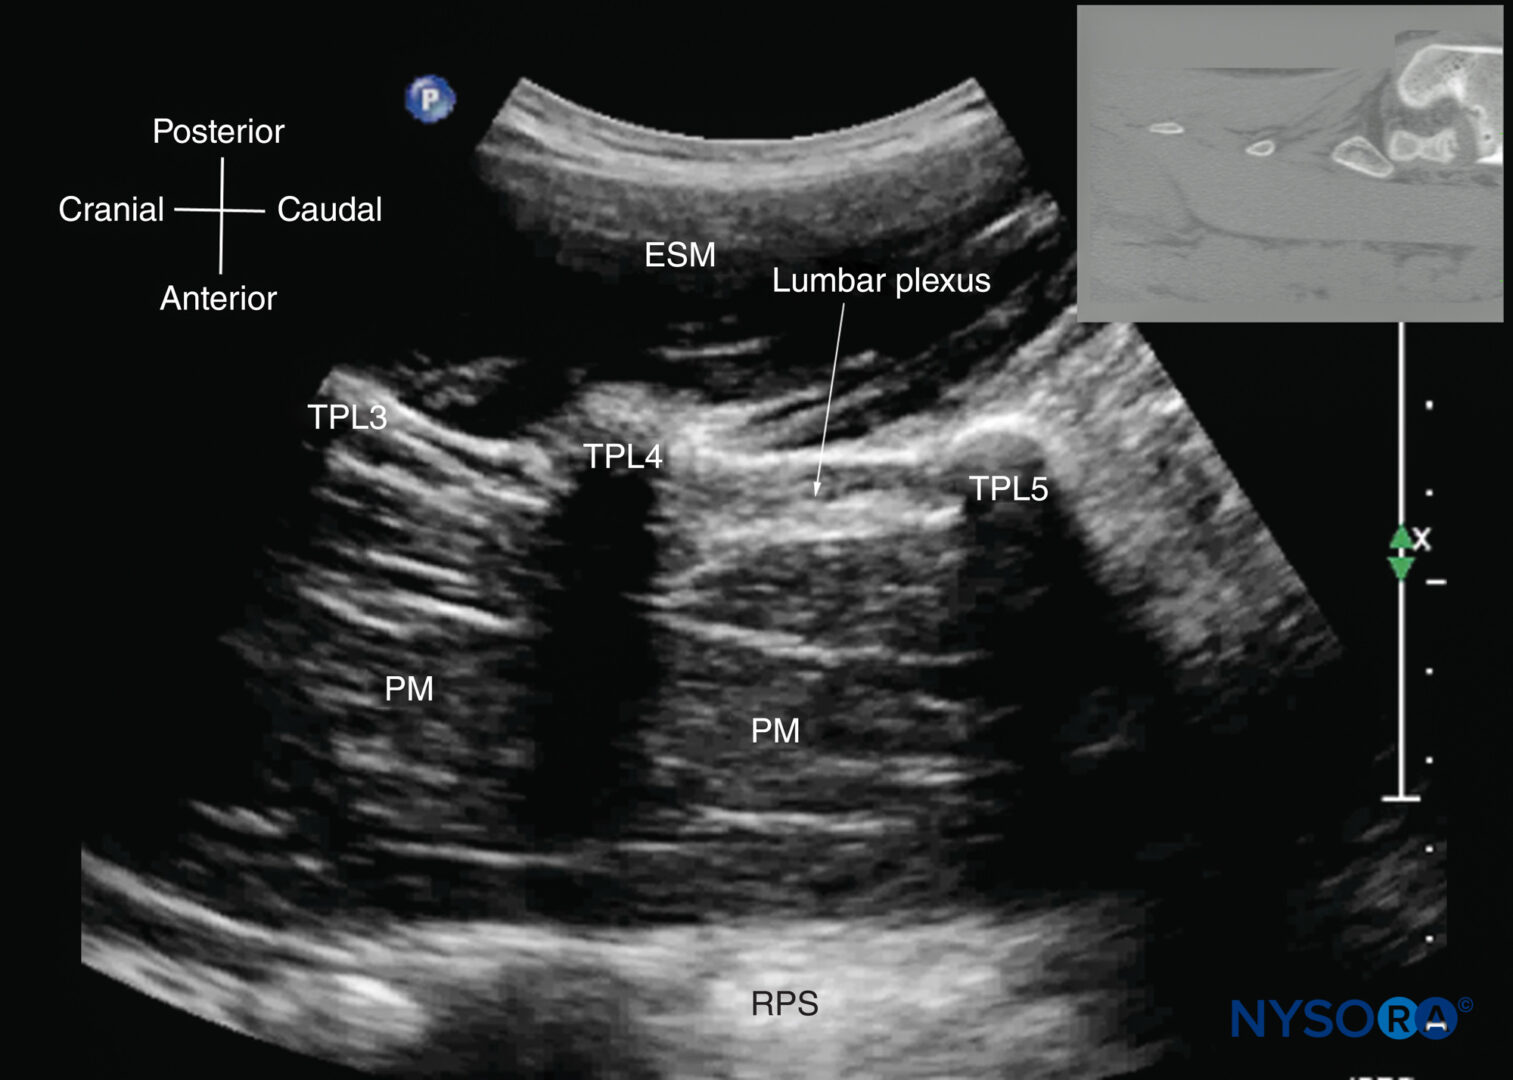
FIGURE 25. Paramedian sagittal sonogram of the lumbar spine at the level of the transverse processes (TPs). Note the hyperechoic reflections of the TPs with their acoustic shadow that produces the “trident sign.” The psoas muscle (PM) is seen in the acoustic window between the transverse processes and is recognized by its typical hypoechoic and striated appearance. Part of the lumbar plexus is also seen as a hyperechoic shadow in the posterior part of the psoas muscle between the transverse processes of the L4 and L5 vertebrae. The inset image shows a corresponding computed tomography (CT) scan of the lumbosacral spine at the level of the TPs. The CT slice was reconstructed from a three-dimensional CT dataset from the author’s archive. ESM, erector spinae muscle; RPS, retroperitoneal space.
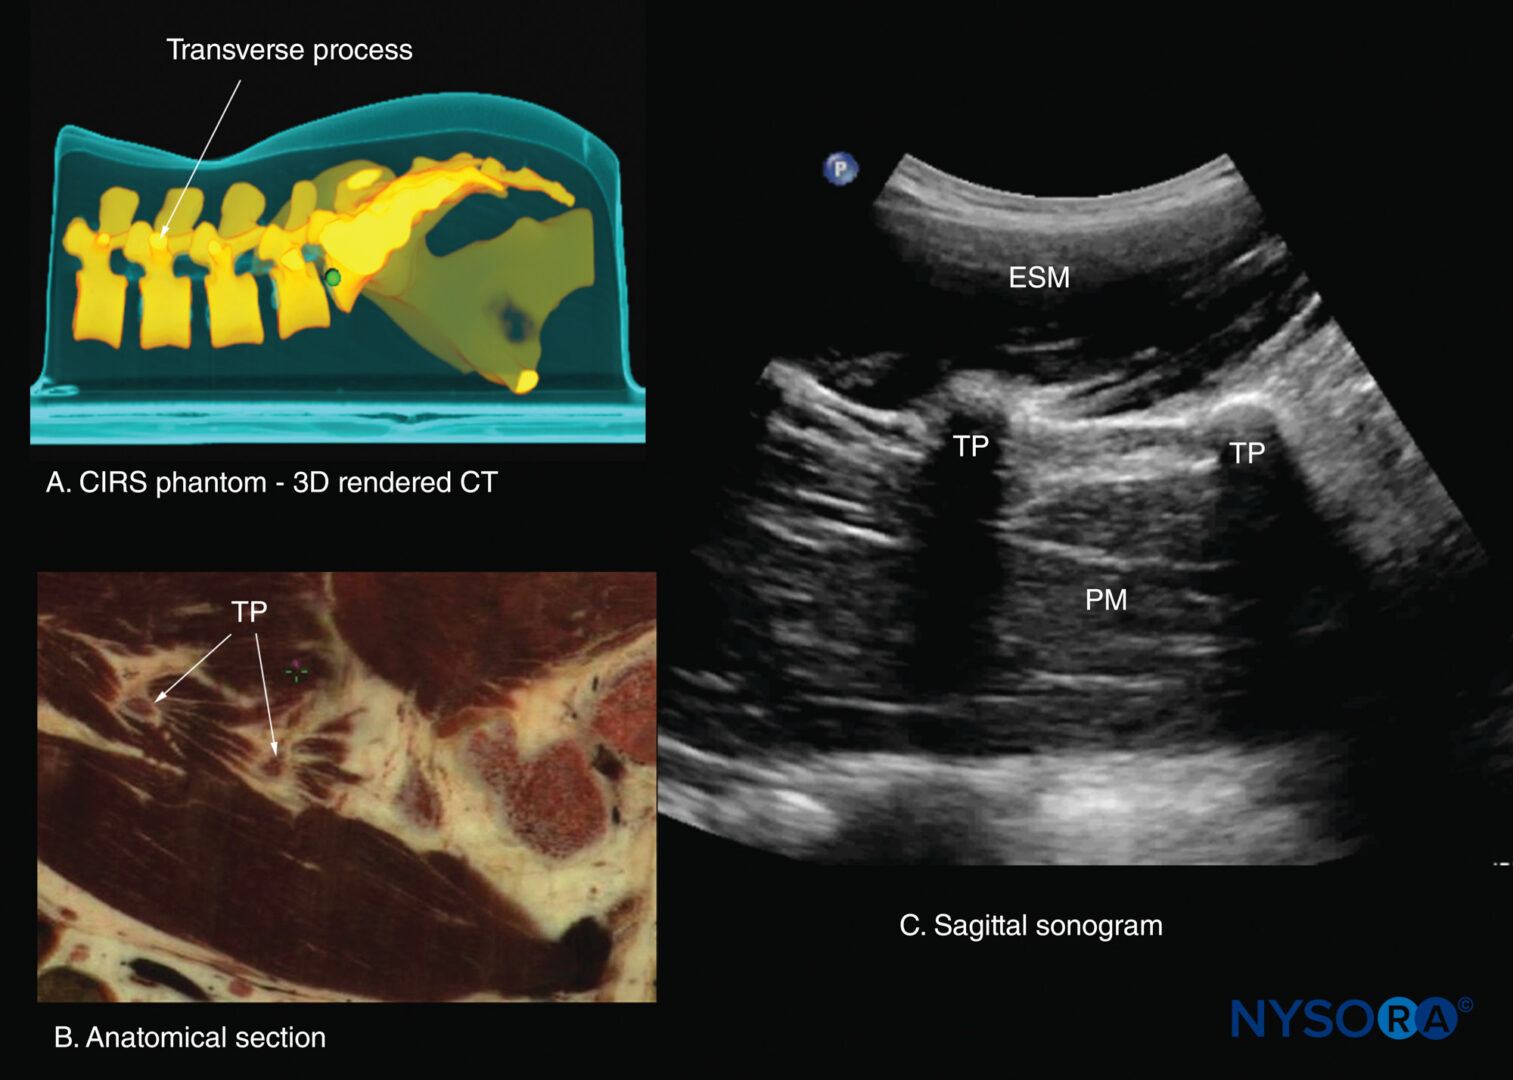
FIGURE 26. Paramedian sagittal sections of the lumbar spine at the level of the transverse processes (TPs). (A) Three-dimensional (3D) reconstruction of a high-resolution computed tomography (CT) scan dataset from the CIRS phantom. (B) Paramedian sagittal cadaver anatomical section. (C) Paramedian sagittal sonogram. ESM, erector spinae muscle; PM, psoas major muscle.
Transverse Scan
For a transverse scan of the lumbar spine, the US transducer is positioned over the spinous process (transverse spinous process view; see Figure 7a), with the patient in the sitting or lateral position. On a transverse sonogram, the spinous process and the lamina on either side are seen as a hyperechoic reflection anterior to which there is a dark acoustic shadow that completely obscures the underlying spinal canal and thus the neuraxial structures (Figures 27 and 28). Therefore, this view is not suitable for imaging the neuraxial structures but can be useful for identifying the midline when the spinous processes cannot be palpated (eg, in obese patients).
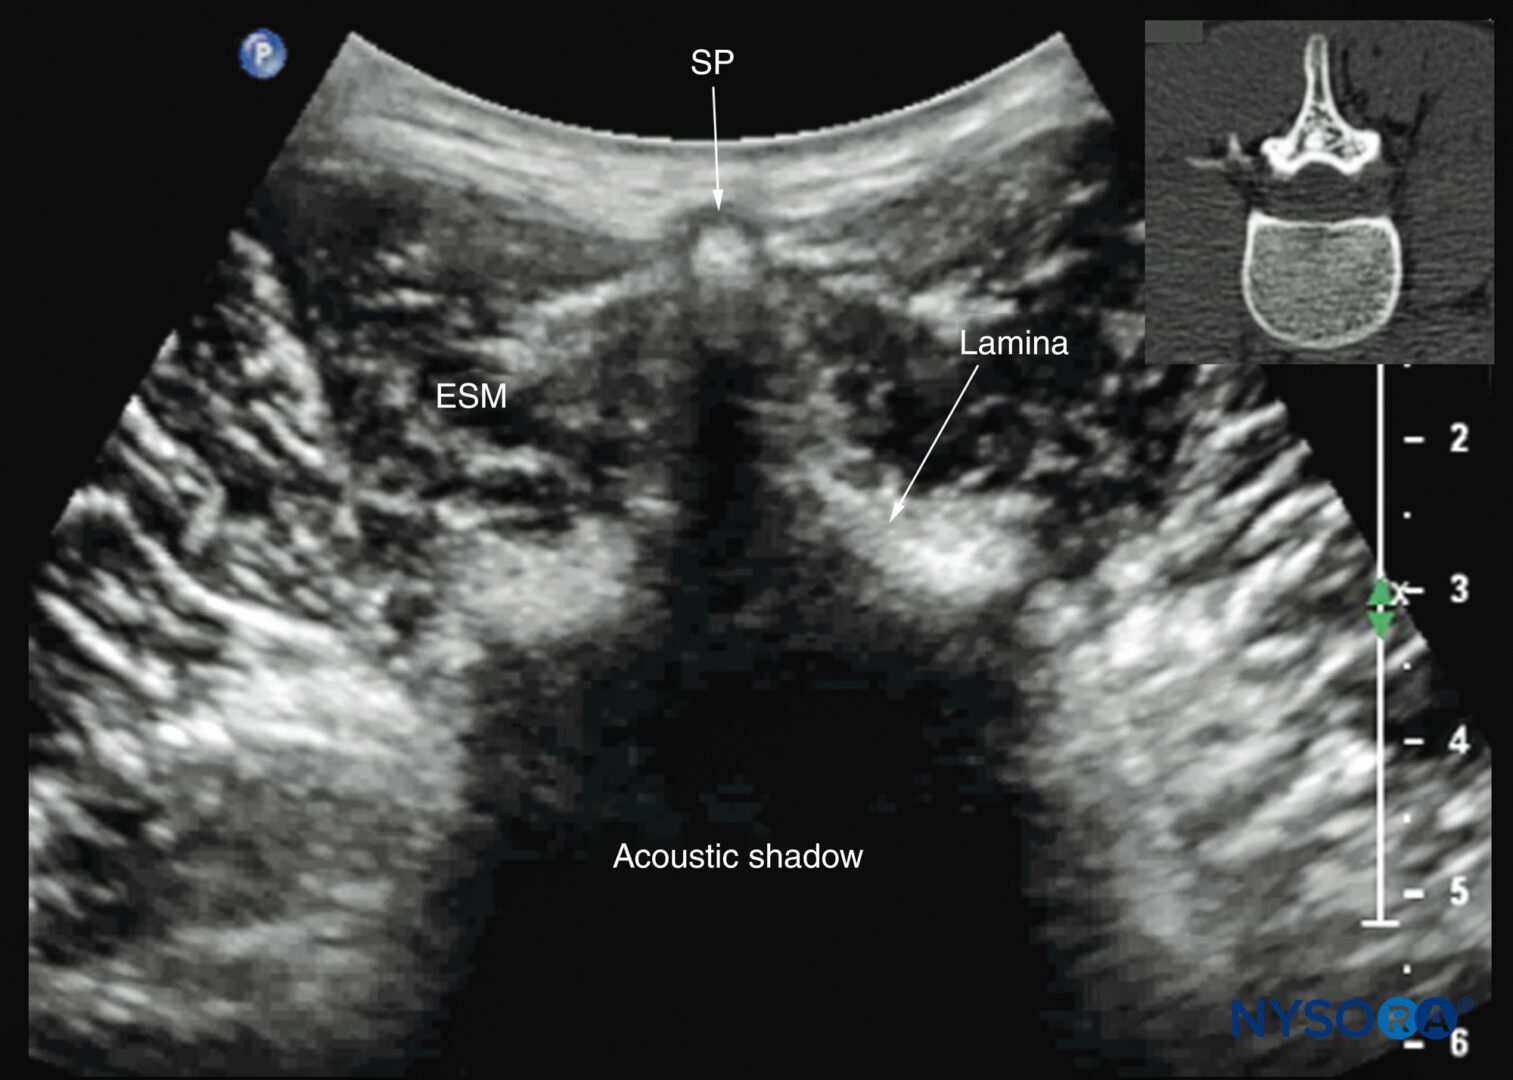
FIGURE 27. Transverse sonogram of the lumbar spine with the transducer positioned directly over the L4 spinous process (transverse spinous process view). Note the acoustic shadow of the spinous process and lamina, which completely obscures the spinal canal and the neuraxial structures. The inset image shows a corresponding computed tomography (CT) scan of the lumbar vertebra. The CT slice was reconstructed from a three-dimensional CT dataset from the author’s archive. ESM, erector spinae muscle; SP, spinous process.
However, by sliding the transducer slightly cranially or caudally, it is possible to perform a transverse scan through the interspinous or interlaminar space (transverse interspinous view; Figures 7b, 29, and 30). A slight tilt of the transducer cranially or caudally may be needed to align the US beam with the interspinous space and optimize the US image. In the transverse interspinous view, the posterior dura, thecal sac, and anterior complex are visualized (from a posterior to anterior direction) within the spinal canal in the midline and the articular processes, and the transverse processes are visualized laterally (see Figures 29 and 30). The osseous elements produce a sonographic pattern that resembles a cat’s head, with the spinal canal representing the head, the articular processes representing the ears, and the transverse processes representing the whiskers (the “cat’s head sign”) (see Figure 10d).
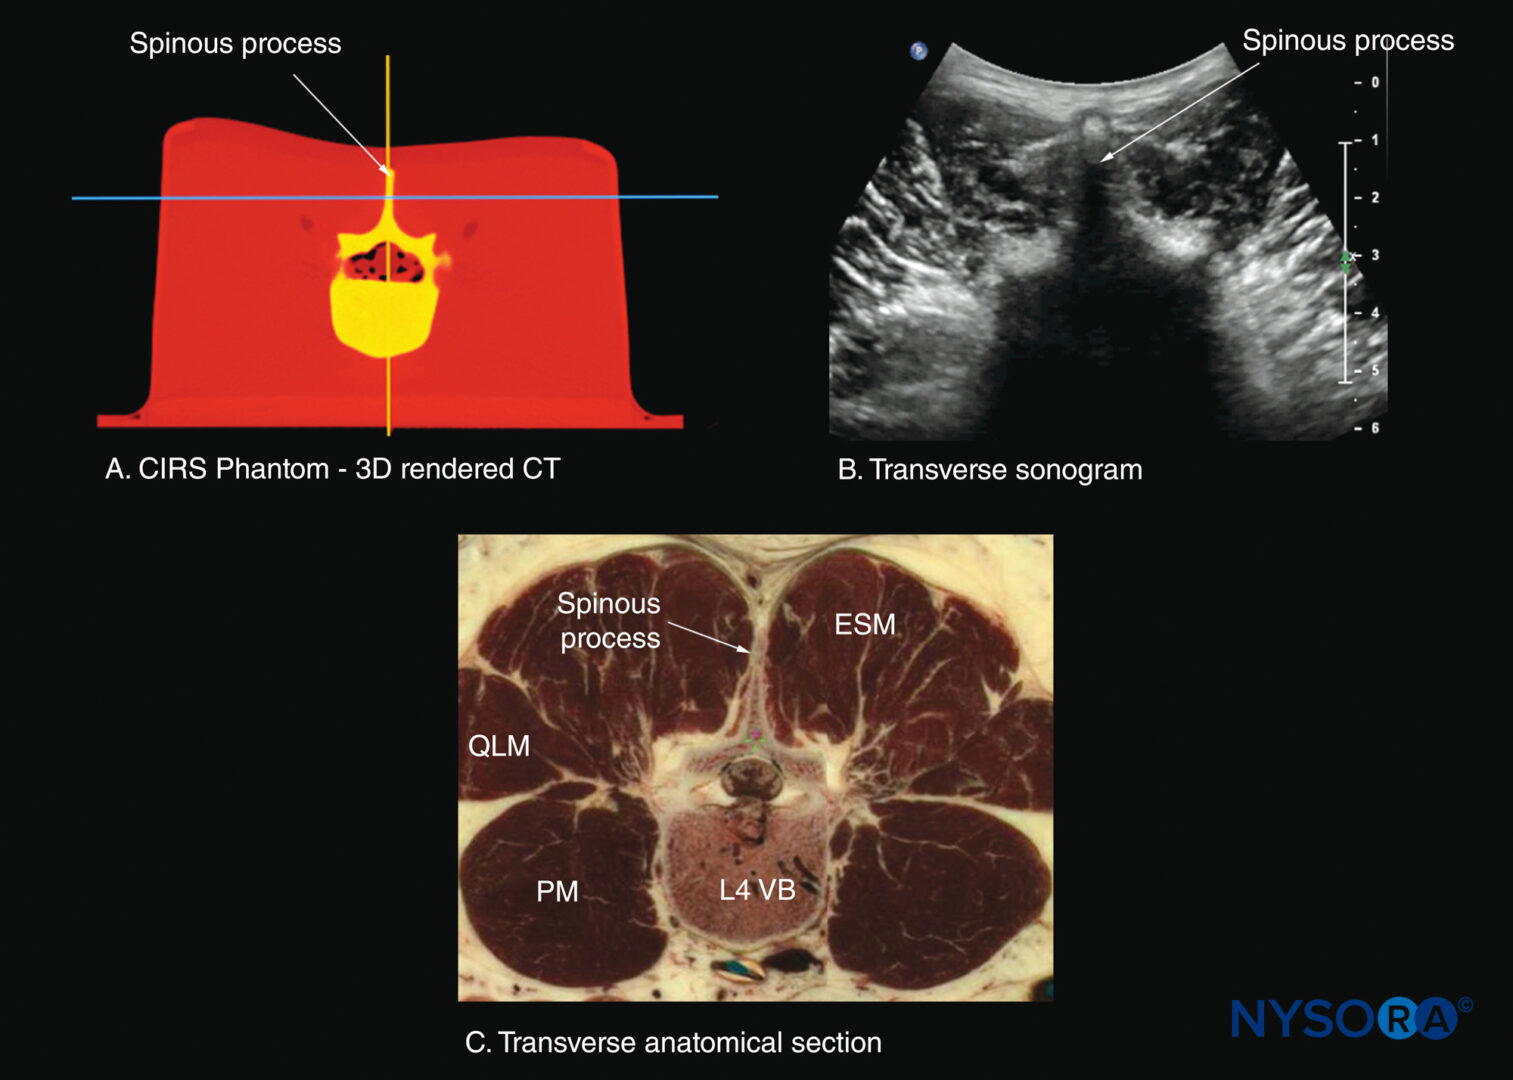
FIGURE 28. Transverse sections of the lumbar spine at the level of the L4 spinous process (SP). (A) Transverse slice rendered from a high-resolution computed tomography (CT) scan dataset from the CIRS phantom. (B) Sonogram: transverse spinous process view. (B) Transverse cadaver anatomical section. ESM, erector spinae muscle; PM, psoas major muscle; QLM, quadratus lumborum muscle; VB, vertebral body.
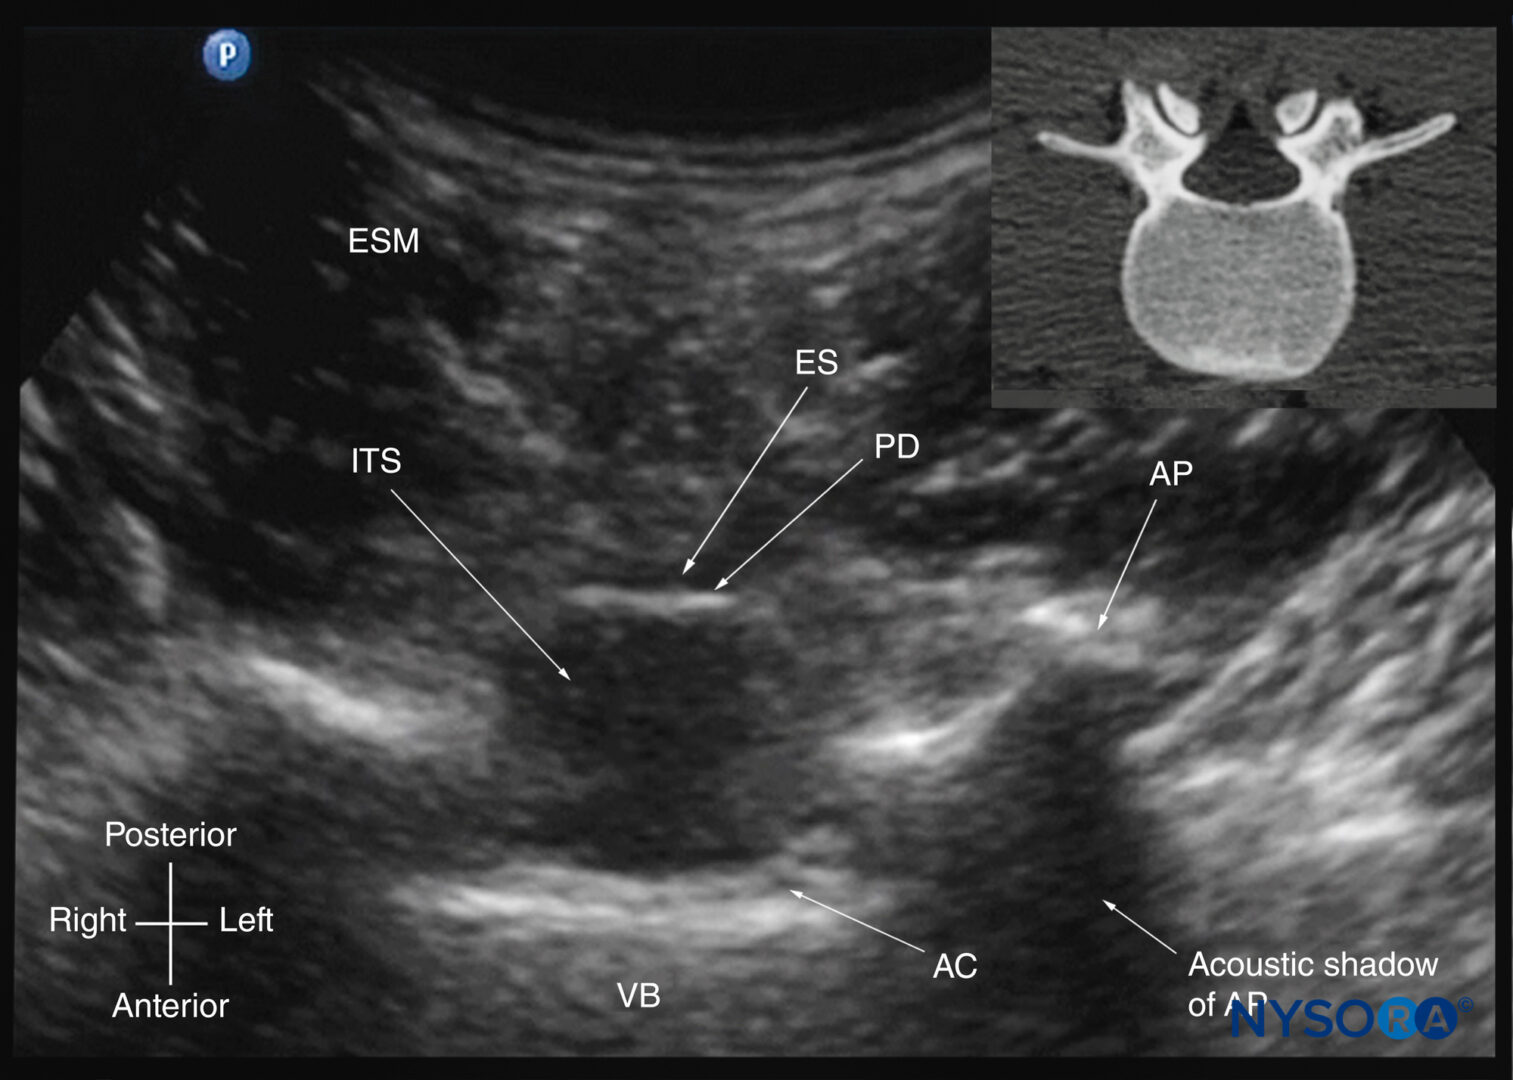
FIGURE 29. Transverse sonogram of the lumbar spine with the transducer positioned such that the US beam is insonated through the interspinous space (transverse interspinous view). The epidural space, posterior dura, intrathecal space, and anterior complex are visible in the midline, and the articular process (AP) is visible laterally on either side of the midline. Note how the articular processes on either side are symmetrically located. The inset image shows a corresponding computed tomography (CT) scan of the lumbar vertebra. The CT slice was reconstructed from a three-dimensional CT dataset from the author’s archive. AC, anterior complex; ES, epidural space; ESM, erector spinae muscle; ITS, intrathecal space; PD, posterior dura; VB, vertebral body
The ligamentum flavum is rarely visualized in the transverse interspinous view, possibly due to anisotropy caused by the arch-like attachment of the ligamentum flavum to the lamina. The epidural space is also less frequently visualized in the transverse interspinous view than in the PMSOS. The transverse interspinous view can be used to examine for rotational deformities of the vertebrae, such as in scoliosis. Normally, both the laminae and the articular processes on either side should be symmetrically located (see Figures 10d, 13b, and 29). However, if there is asymmetry, a rotational deformity of the vertebral column should be suspected and the needle trajectory altered accordingly.

FIGURE 30. Transverse sections of the lumbar spine at the level of the L3–4 interspinous space. (A) Transverse slice rendered from a high-resolution computed tomography (CT) scan dataset from the CIRS phantom. (B) Sonogram: transverse interspinous view. (C) Transverse cadaver anatomical section. AC, anterior complex; AP, articular process; ES, epidural space; ESM, erector spinae muscle; ITS, intrathecal sac; LF, ligamentum flavum; PM, psoas major muscle; QLM, quadratus lumborum muscle; TP, transverse process; VB, vertebral body.
ULTRASOUND IMAGING OF THE THORACIC SPINE
US imaging of the thoracic spine is more challenging than the lumbar spine. The ability to visualize the neuraxial structures with US may vary with the level at which the imaging is performed, with poorer visibility of the neuraxis in the upper thoracic levels. Regardless of the level at which the scan is performed, the thoracic spine is probably best imaged with the patient in the sitting position. In the lower thoracic region (T9–T12), the sonographic appearance of the neuraxial structures (Figure 31) is comparable to that in the lumbar region because of comparable vertebral anatomy. However, the acute caudal angulation of the spinous processes and the narrow interspinous and interlaminar spaces in the midthoracic region (T4–T8) results in a narrow acoustic window with limited visibility of the underlying neuraxial anatomy (Figures 32 and 33).
Grau and colleagues performed US imaging of the thoracic spine at the T5–T6 level in young volunteers and correlated findings with matching magnetic resonance imaging (MRI) images. They found that the transverse axis produced the best images of the neuraxial structures. However, the epidural space was best visualized in the paramedian sagittal scans. Regardless, US was limited in its ability to delineate the epidural space or the spinal cord but was better than MRI in demonstrating the posterior dura. The transverse interspinous view, however, is almost impossible to obtain in the midthoracic region (see Figure 33), and, therefore, the transverse scan provides little useful information for CNB other than to help identify the midline.
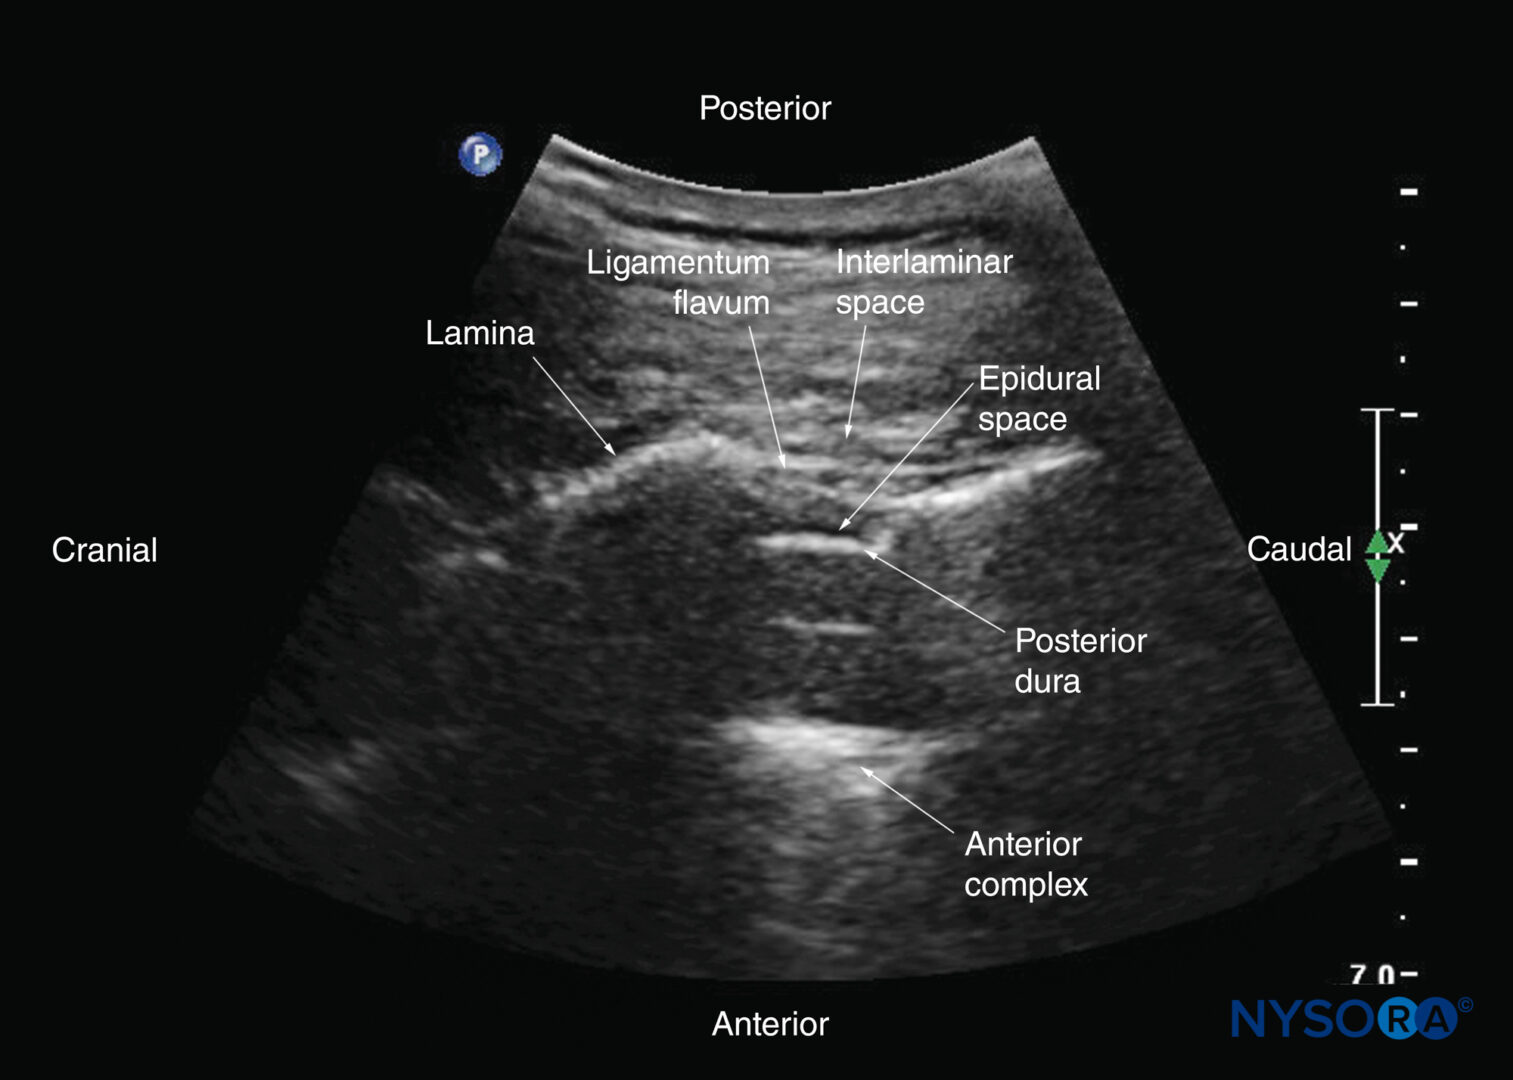
FIGURE 31. Paramedian sagittal oblique sonogram of the lower thoracic spine. The acoustic window is relatively large; through it, the ligamentum flavum, posterior dura, epidural space, and anterior complex are clearly visible.
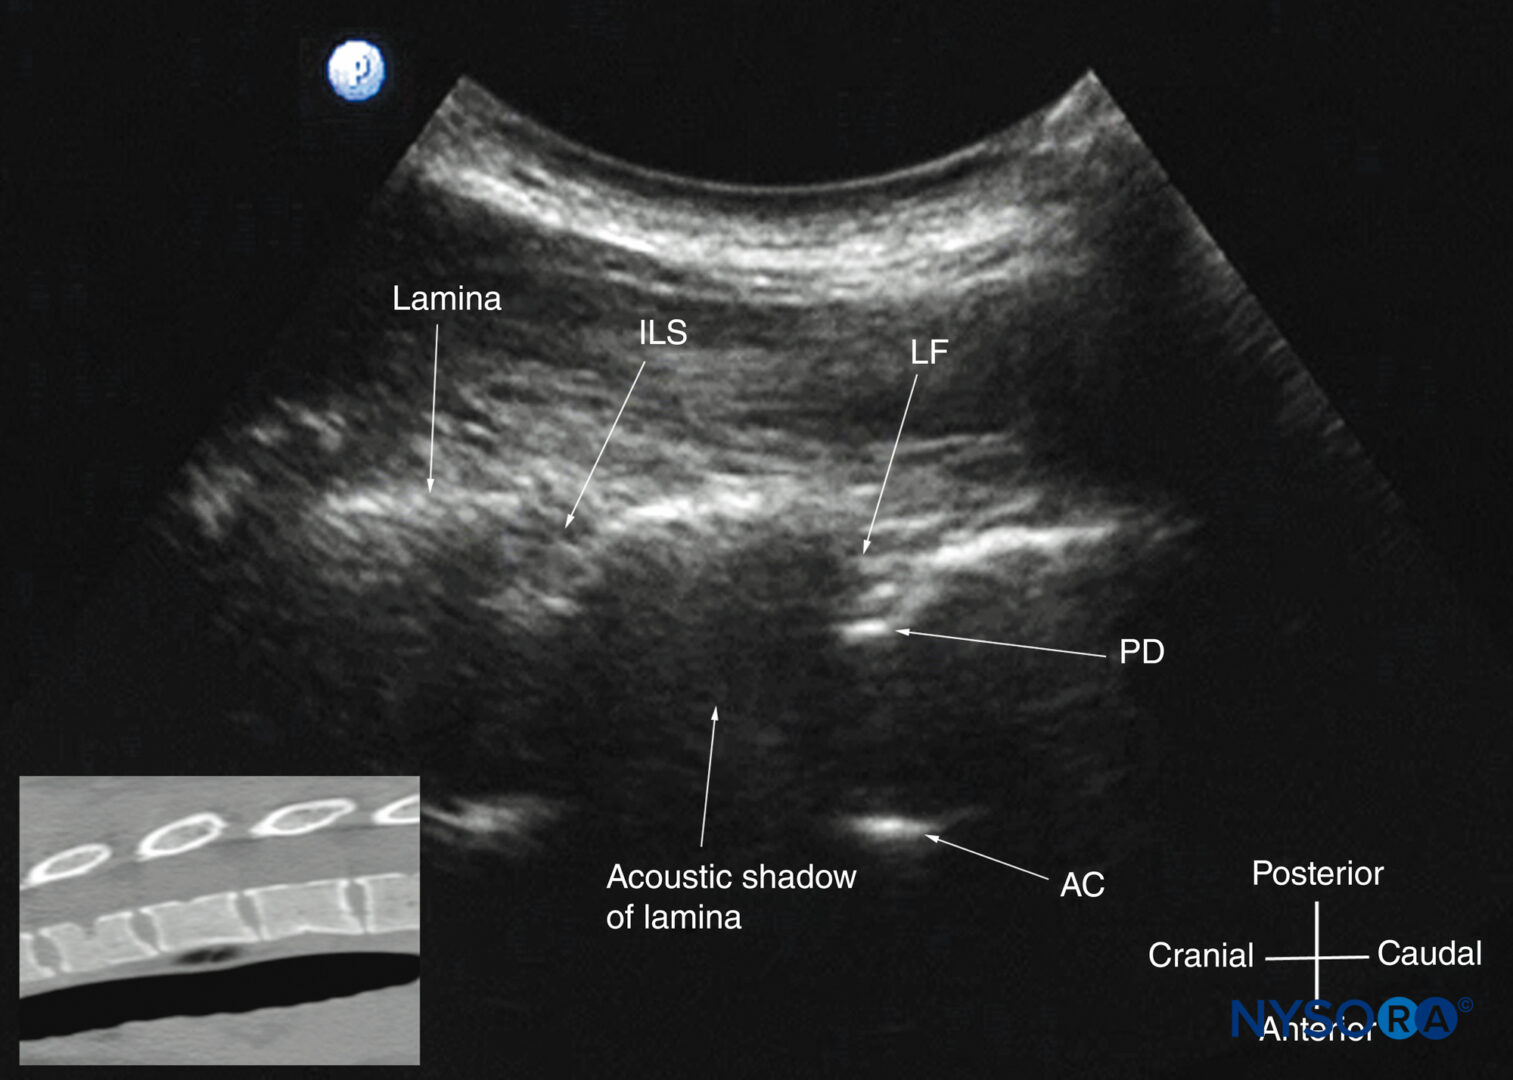
FIGURE 32. Paramedian sagittal oblique sonogram of the midthoracic spine. The posterior dura (PD) and the anterior complex (AC) are visible through the narrow acoustic window. The inset image shows a corresponding computed tomography (CT) scan of the midthoracic spine. The CT slice was reconstructed from a three-dimensional CT dataset from the author’s archive. ILS, interlaminar space; LF, ligamentum flavum.
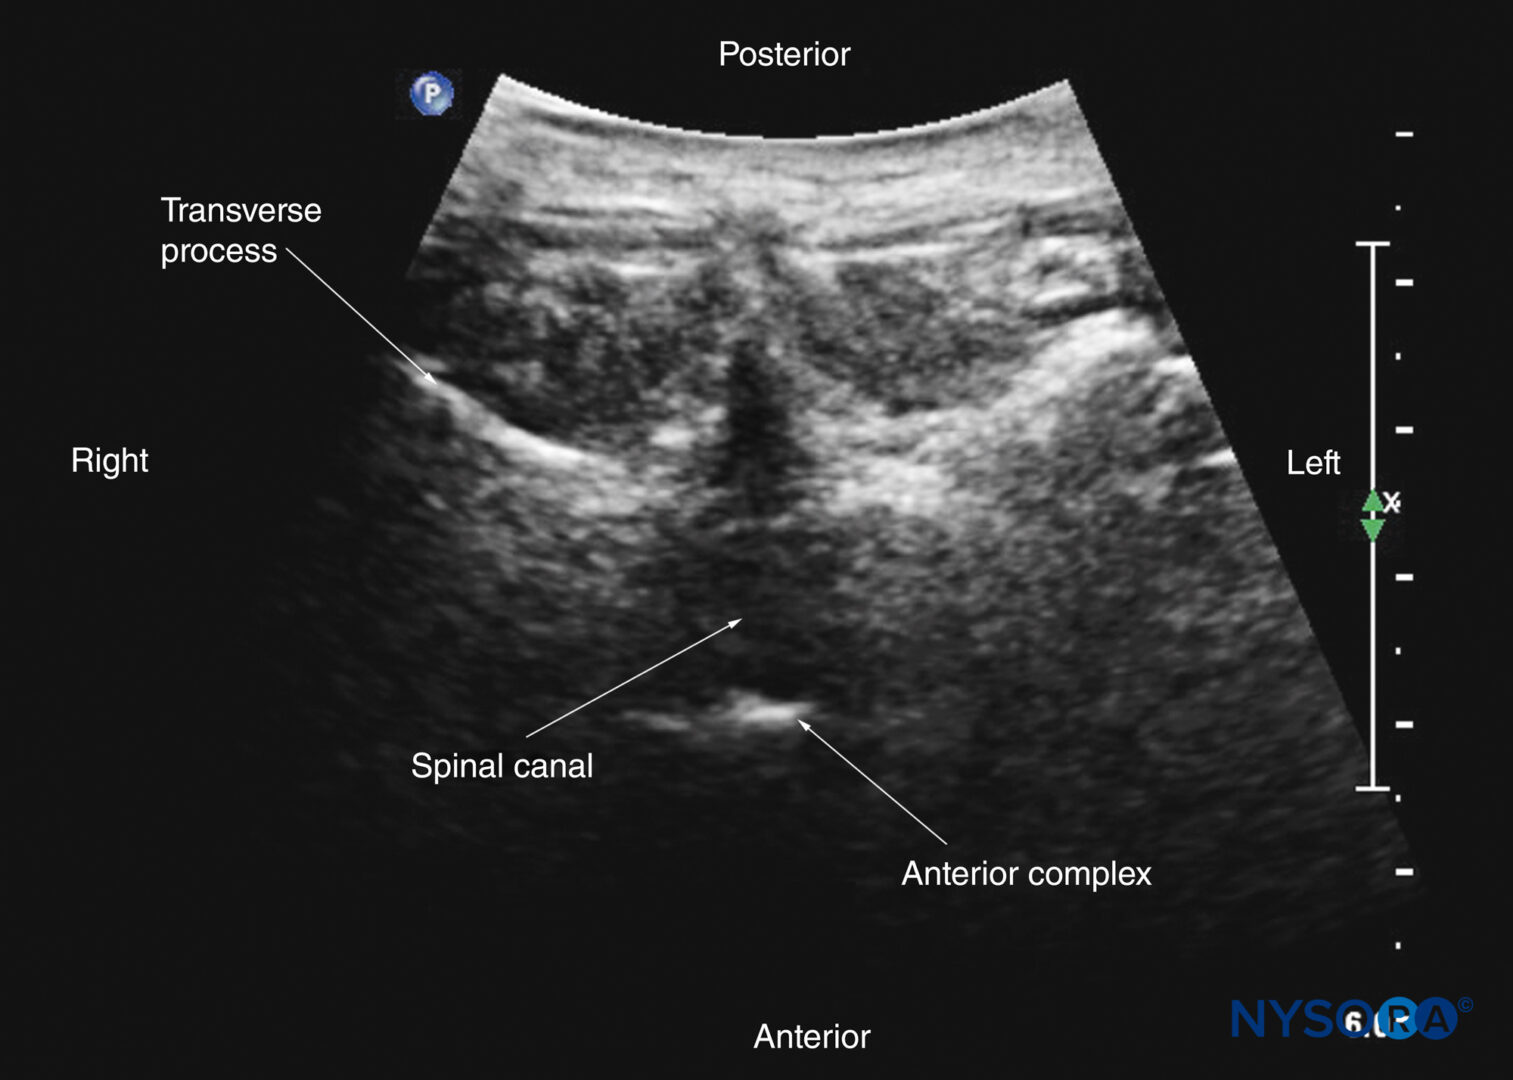
FIGURE 33. Transverse interspinous sonogram of the midthoracic region. Visualization of the posterior dura and anterior complex can be very challenging in the midthoracic region due to the acute angulation of the spinous processes and requires cranial angulation of the US transducer.
In contrast, the PMSOS (see Figure 32), despite the narrow acoustic window, provides more useful information relevant for CNB. The laminae are seen as flat hyperechoic structures with acoustic shadowing anteriorly, and the posterior dura is consistently visualized in the acoustic window (see Figure 32). However, the epidural space, spinal cord, central canal, and anterior complex are difficult to delineate and only rarely visualized in the midthoracic region (see Figure 32). CNBs are rarely performed in the upper thoracic spine (T1–T4), but US imaging is possible despite the narrow acoustic window (Figures 34 and 35).
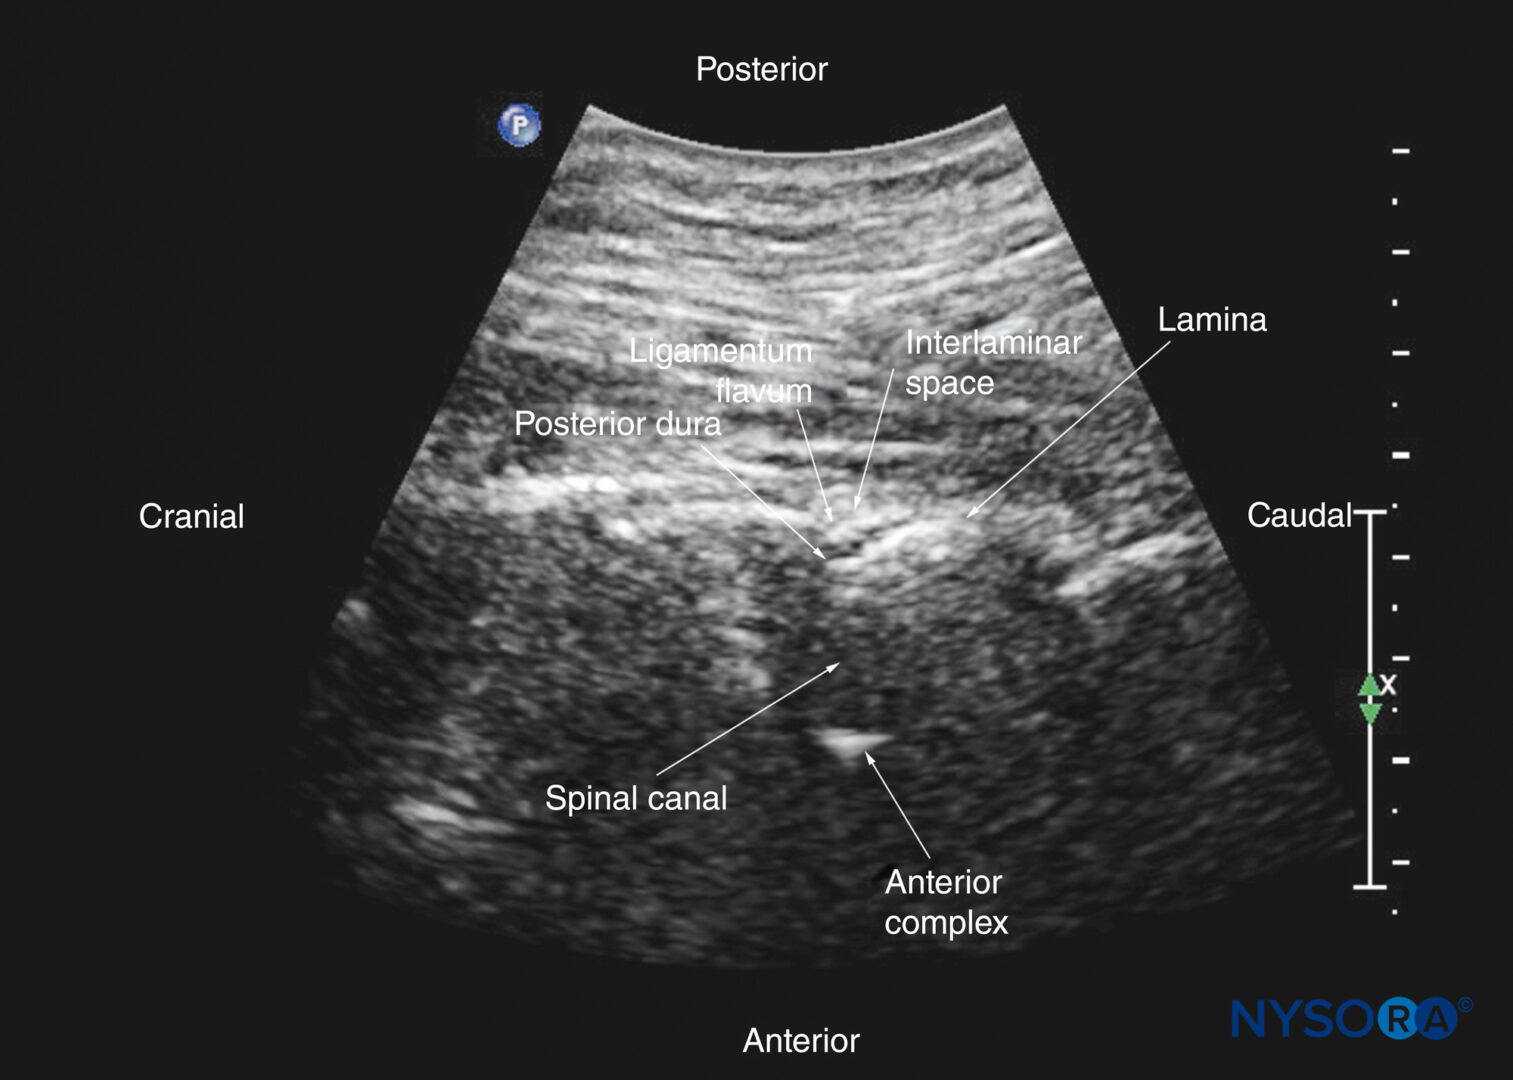
FIGURE 34. Paramedian sagittal oblique sonogram of the upper thoracic spine. The posterior dura and the anterior complex are visible through the narrow acoustic window.
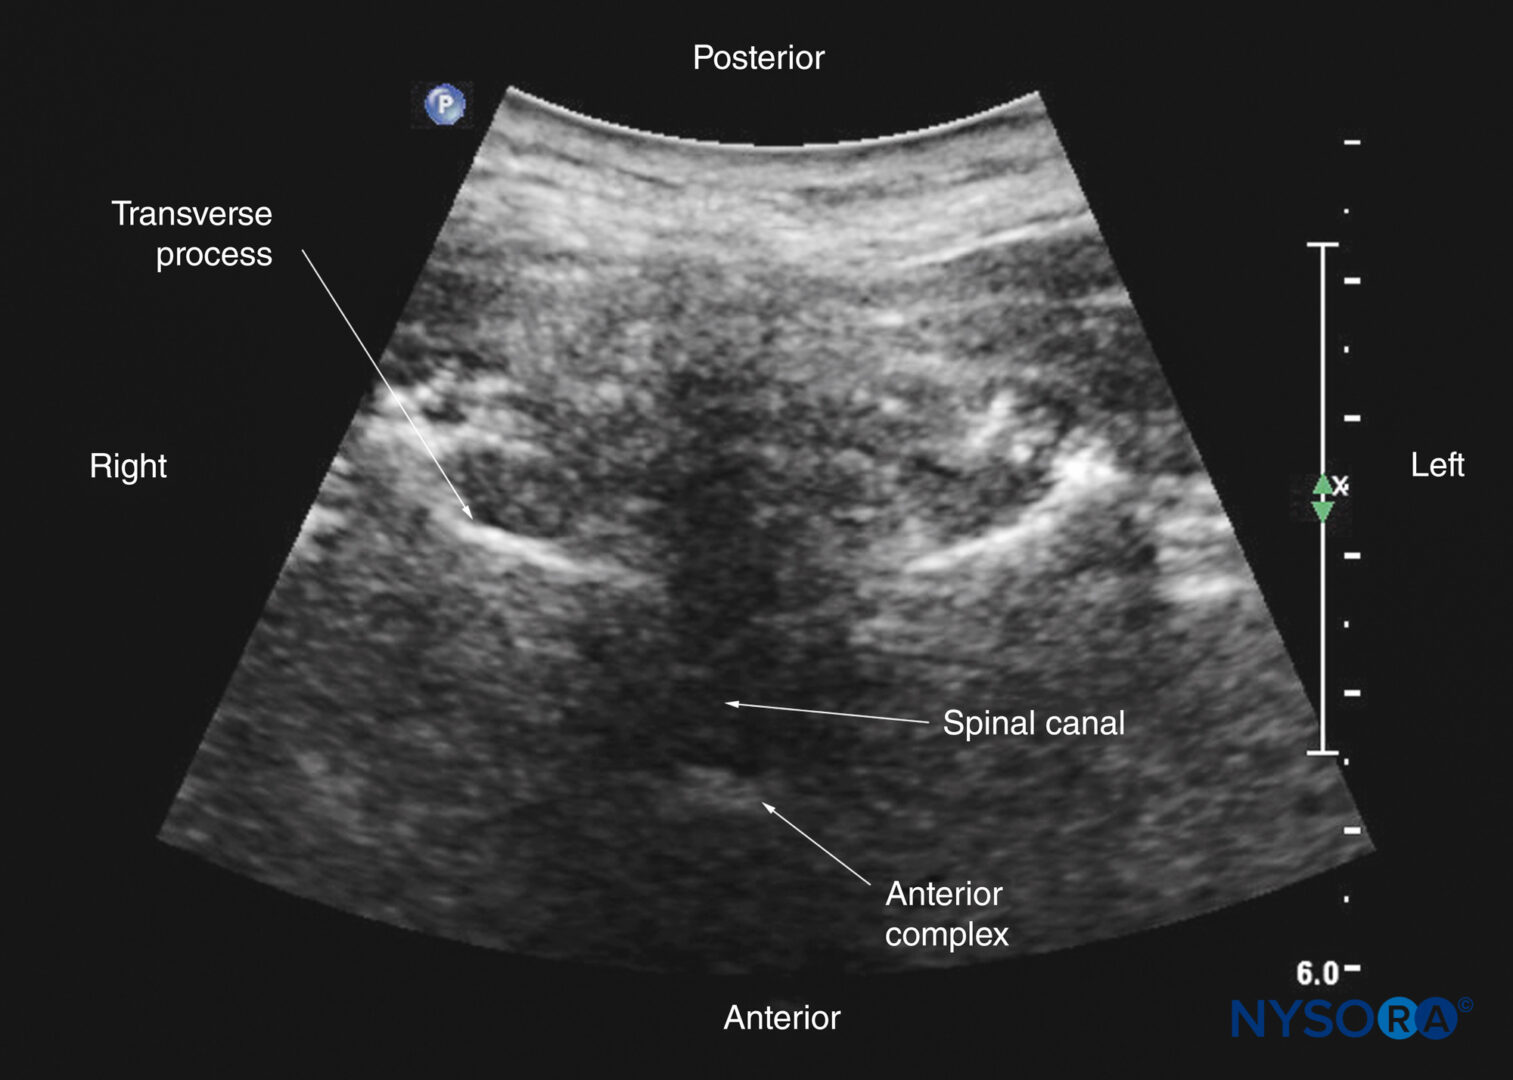
FIGURE 35. Transverse interspinous sonogram of the upper thoracic spine.
ULTRASOUND IMAGING OF THE SACRUM
US imaging of the sacrum is most commonly performed to identify the sonoanatomy relevant for a caudal epidural injection. Because the sacrum is a superficial structure, a high-frequency linear array transducer can be used for the scan. The patient is positioned in the lateral or prone position, with a pillow under the abdomen to flex the lumbosacral spine. The caudal epidural space is the continuation of the lumbar epidural space and commonly accessed via the sacral hiatus. The sacral hiatus is located at the distal end of the sacrum and is covered by the sacrococcygeal ligament. Its lateral margins are formed by the two sacral cornua. On a transverse sonogram of the sacrum at the level of the sacral hiatus, the sacral cornua are seen as two hyperechoic reversed U-shaped structures, one on either side of the midline (Figure 36).
Connecting the two sacral cornua, and deep to the skin and subcutaneous tissue, is a hyperechoic band: the sacrococcygeal ligament (see Figure 36). Anterior to the sacrococcygeal ligament is another hyperechoic linear structure, which represents the posterior surface of the sacrum. The hypoechoic space between the sacrococcygeal ligament and the bony posterior surface of the sacrum is the caudal epidural space (see Figure 36). The two sacral cornua and the posterior surface of the sacrum produce a pattern on the sonogram that is referred to as the “frog eye sign” because of its resemblance to the eyes of a frog (see Figure 36). On a sagittal sonogram of the sacrum at the level of the sacral cornua, the sacrococcygeal ligament, the base of sacrum, and the caudal canal are also clearly visualized (Figure 37). However, due to the acoustic shadow of the posterior surface of the sacrum, only the lower part of the caudal epidural space is seen (see Figure 37).
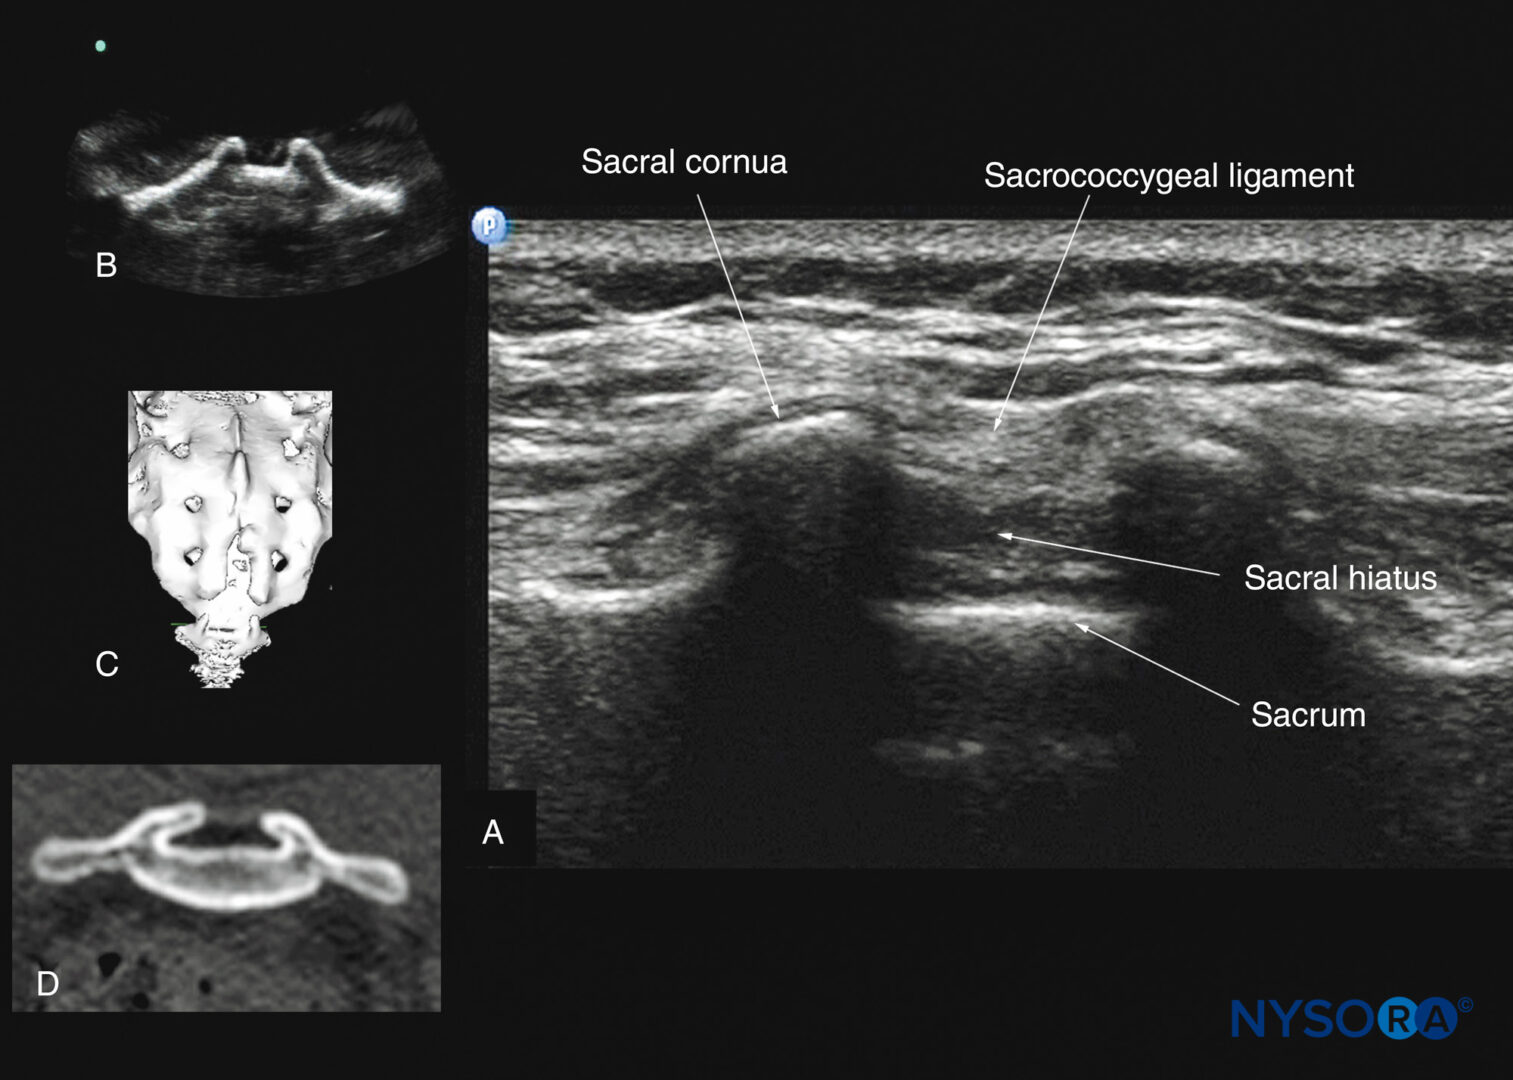
FIGURE 36. Transverse sonogram of the sacrum at the level of the sacral hiatus. Note the two sacral cornua and the hyperechoic sacrococcygeal ligament that extends between the two sacral cornua. (A) The hypoechoic space between the sacrococcygeal ligament and the posterior surface of the sacrum is the sacral hiatus. The image in (B) shows the sacral cornua from the water-based spine phantom; the image in (C) shows a three-dimensional (3D) reconstructed image of the sacrum at the level of the sacral hiatus from a 3D CT dataset from the author’s archive; and the image in (D) shows a transverse CT slice of the sacrum at the level of the sacral cornua.
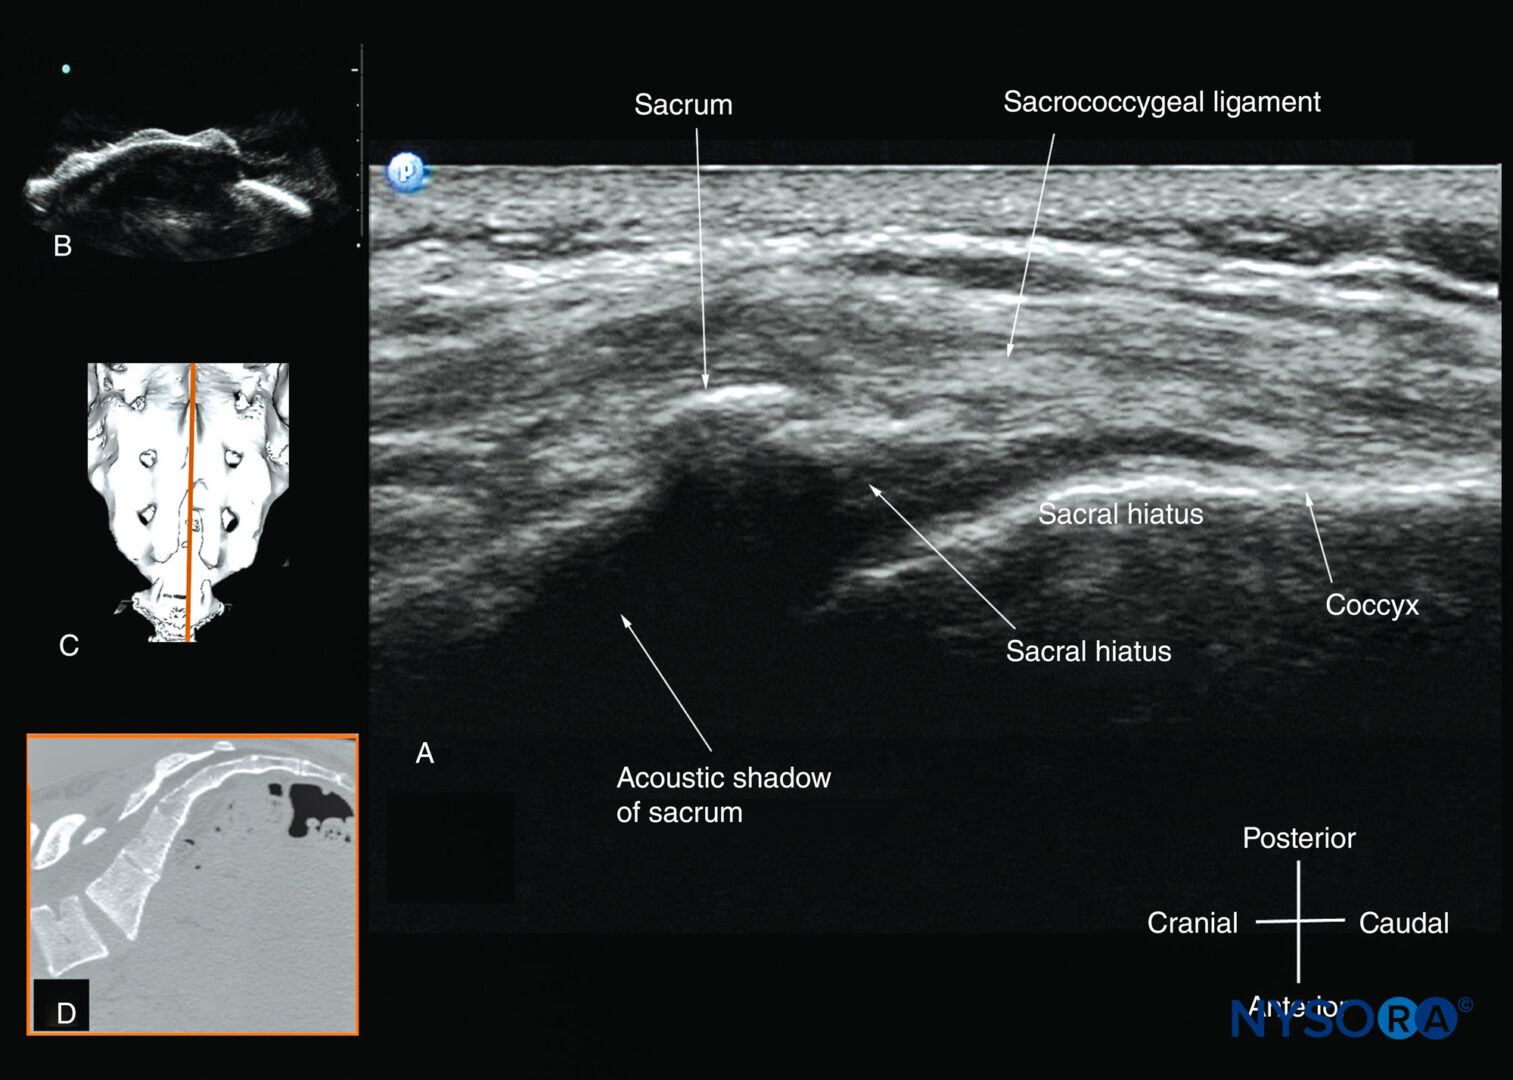
FIGURE 37. Sagittal sonogram of the sacrum at the level of the sacral hiatus. Note the hyperechoic sacrococcygeal ligament that extends from the sacrum to the coccyx and the acoustic shadow of the sacrum that completely obscures the sacral canal. The image in (B) shows the sacral hiatus from the water-based spine phantom; the image in (C) shows a three-dimensional (3D) reconstructed image of the sacrum at the level of the sacral hiatus from a 3D CT dataset from the author’s archive; and the image in (D) shows a sagittal CT slice of the sacrum at the level of the sacral cornua.
TECHNICAL ASPECTS OF ULTRASOUND-GUIDED CENTRAL NEURAXIAL BLOCKS
During CNBs, US can be used either as a preprocedural tool or to guide needle insertion in real time. The former involves performing a preprocedural scan (or scout scan) to preview the spinal anatomy and determine the optimal site, depth, and trajectory for needle insertion before performing a traditional spinal or epidural injection. In contrast, the latter technique involves performing a real-time USG CNB by one or two operators. Real-time USG CNB demands a high degree of manual dexterity and hand–eye coordination. Therefore, the operator should have a sound knowledge of the basics of US, be familiar with the sonoanatomy of the spine and scanning techniques, and have the necessary interventional skills before attempting a real-time USG CNB. At this time, there are no data on the safety of the US gel if it is introduced into the meninges, subarachnoid space, or nervous tissues during USG CNB. However, data from animal studies in pigs suggests that this results in an inflammatory response within the neuraxial space. Due to the paucity of published data, it is not possible to make recommendations, although some clinicians have resorted to using sterile normal saline solution as an alternative coupling agent to keep the skin moist under the footprint of the transducer during the scan. As a result, there is some degradation in the quality of the US image, but this can be overcome by minor changes in the settings of the US system.
KEY PRINCIPLES
- The use of US to assist or guide CNBs is an advanced technique that can be helpful in patients with difficult spinal anatomy. It is necessary to gain experience with the use of US for neuraxial block before attempting it in patients with difficult anatomy.
- If the posterior or anterior complex cannot be clearly visualized, the articular and transverse processes identified in a transverse scan can serve as surrogate markers of the interlaminar space.
- Asymmetry in the position of the articular processes in a transverse interspinous view of the lumbar spine suggests a rotational defect in the vertebra; for example, as seen in scoliosis.
- The angle of insonation that provides the best visualization of the posterior dura during a transverse interspinous scan usually reflects the angle (trajectory) at which the needle should be inserted during a midline CNB.
- When performing a preprocedural scan, meticulous skin marking and keeping the skin from shifting are important.
- In older patients, the failure to visualize the anterior or posterior complex may indicate narrowed interspaces from degenerative disease. Neuraxial block may still be possible, but difficulty should be anticipated, and there should be a lower threshold for proceeding to alternative methods of anesthesia or analgesia.
- Strict asepsis must be maintained, and we recommend local protocols be established for USG CNB.
- Attention to detail with positioning of the patient and ergonomics go a long way in ensuring success during a USG CNB.
- Needle deviation during insertion may occur, especially with long, thin (25-gauge or less) needles in obese subjects. This can be avoided by careful needle handling and the use of introducer needles or larger-gauge needles (22-gauge or larger) for the CNB.
- If bone is encountered during needle insertion, subsequent alterations in trajectory should be small and gradual to avoid overshooting the interlaminar space.
- The lumbosacral junction (L5–S1 gap) is the largest interlaminar space and must not be overlooked in patients with difficult spines, as it may provide a safe route for access to the neuraxis for CNBs.
TYPES OF INJECTION
Spinal Injection
There are limited data in the published medical literature on the use of US for spinal (intrathecal) injections, although US has been reported to guide lumbar punctures by radiologists and emergency physicians. Most available data are anecdotal case reports. Yeo and French, in 1999, were the first to describe the successful use of US to assist spinal injection in a patient with abnormal spinal anatomy. They used US to locate the vertebral midline in a parturient with severe scoliosis with Harrington rods in situ. Yamauchi and colleagues have described using US to preview the neuraxial anatomy and measure the distance from the skin to the dura in a post-laminectomy patient before the intrathecal injection was performed under X-ray guidance. Costello and Balki have described using US to facilitate spinal injection by locating the L5–LS1 gap in a parturient with poliomyelitis and previous Harrington rod instrumentation of the spine. Prasad and colleagues have reported using US to assist spinal injection in a patient with obesity, scoliosis, and multiple previous back surgeries with instrumentation. More recently, Chin and colleagues have described real-time USG spinal anesthesia in two patients with abnormal spinal anatomy (one had lumbar scoliosis, and the other had undergone spinal fusion surgery at the L2–L3 level).
Lumbar Epidural Injection
US imaging can be used to preview the underlying spinal anatomy or to guide the Tuohy needle in real time during a lumbar epidural access. Moreover, real-time US guidance for epidural access can be performed by one or two operators. In the latter technique, described by Grau and colleagues for combined spinal epidural anesthesia, one operator performs the US scan via the paramedian axis, while the other carries out the needle insertion through the midline approach using a “loss-ofresistance” technique. Using this approach, Grau and colleagues reported being able to visualize the advancing epidural needle despite different axes of US scan and needle insertion. They were able to visualize the dural puncture in all patients, as well as dural tenting in a few cases, during the needle-throughneedle spinal puncture.
Karmakar and colleagues recently described a technique of real-time USG epidural injection in conjunction with loss of resistance (LOR) to saline. The epidural access was performed by a single operator, and the epidural needle was inserted in the plane of the US beam via the paramedian axis. Generally, it is possible to visualize the advancing epidural needle in real time until it engages in the ligamentum flavum. The need for a second operator to perform the LOR can be circumvented by using a spring-loaded syringe (eg, Episure AutoDetect syringe, Indigo Orb, Inc., Irvine, CA) with an internal compression spring that applies constant pressure on the plunger (Figure 38). Anterior displacement of the posterior dura and widening of the posterior epidural space are the most frequently visualized changes within the spinal canal. Compression of the thecal sac can be seen occasionally. These ultrasonographic signs (Figure 39) of a correct epidural injection were previously described in children. The neuraxial changes that occur within the spinal canal following the “loss of resistance” to saline may have clinical significance.
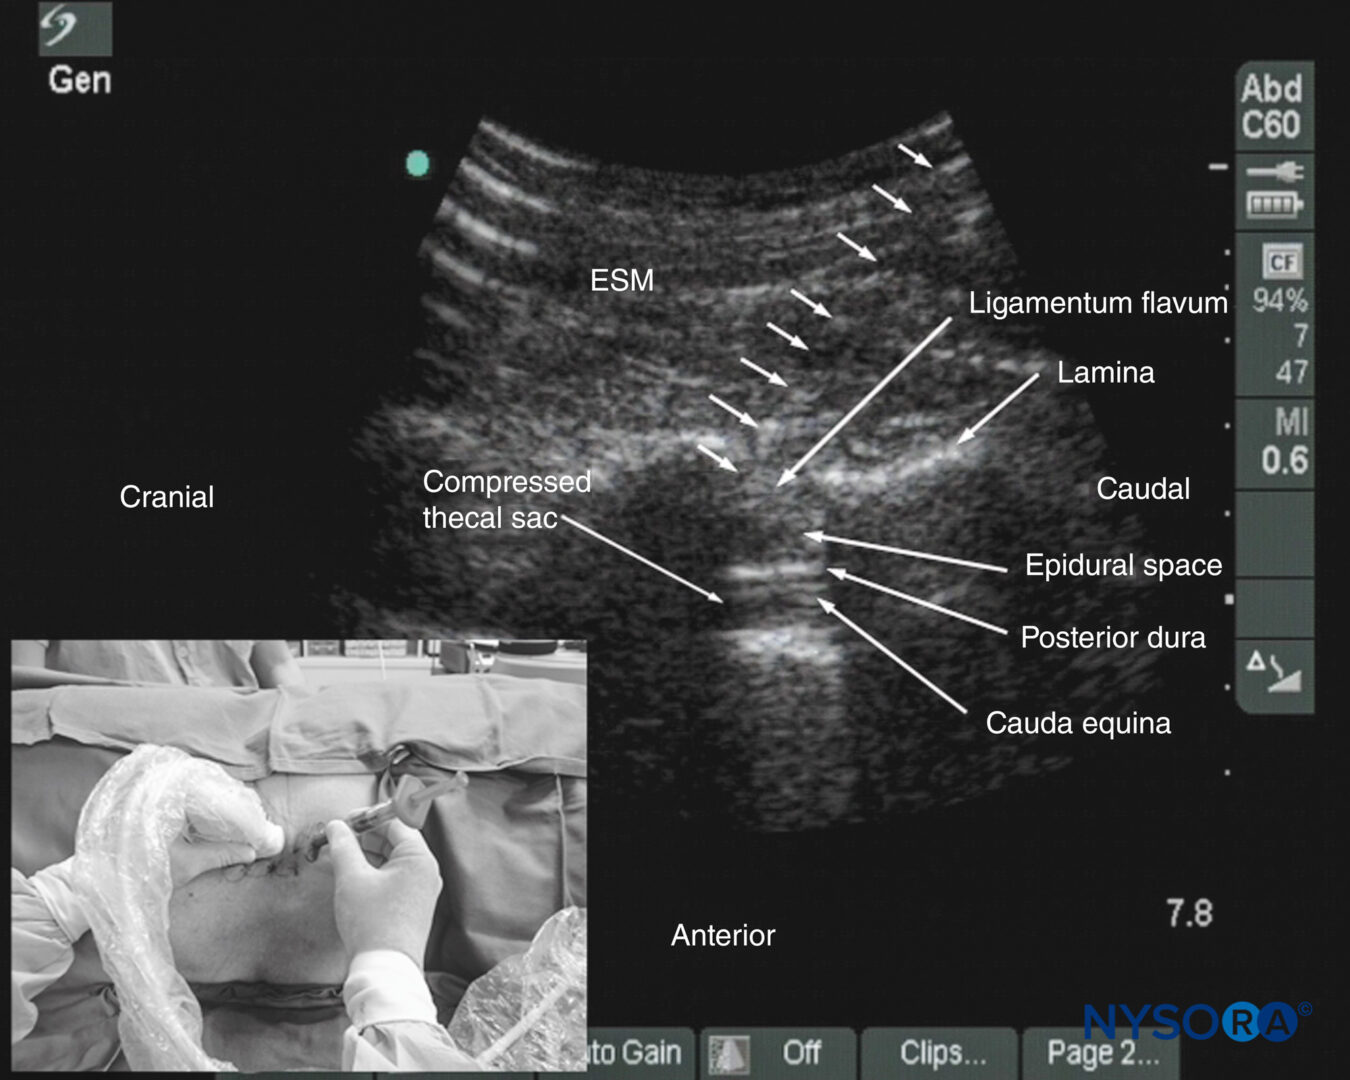
FIGURE 38. Paramedian oblique sagittal sonogram of the lumbar spine showing the sonographic changes within the spinal canal after the “loss of resistance” to saline. Note the anterior displacement of the posterior dura, the widening of the posterior epidural space, and the compression of the thecal sac. The cauda equina nerve roots are also now better visualized within the compressed thecal sac in this patient. The inset image shows how the Episure AutoDetect syringe was used to circumvent the need for a third hand for the “loss of resistance.”
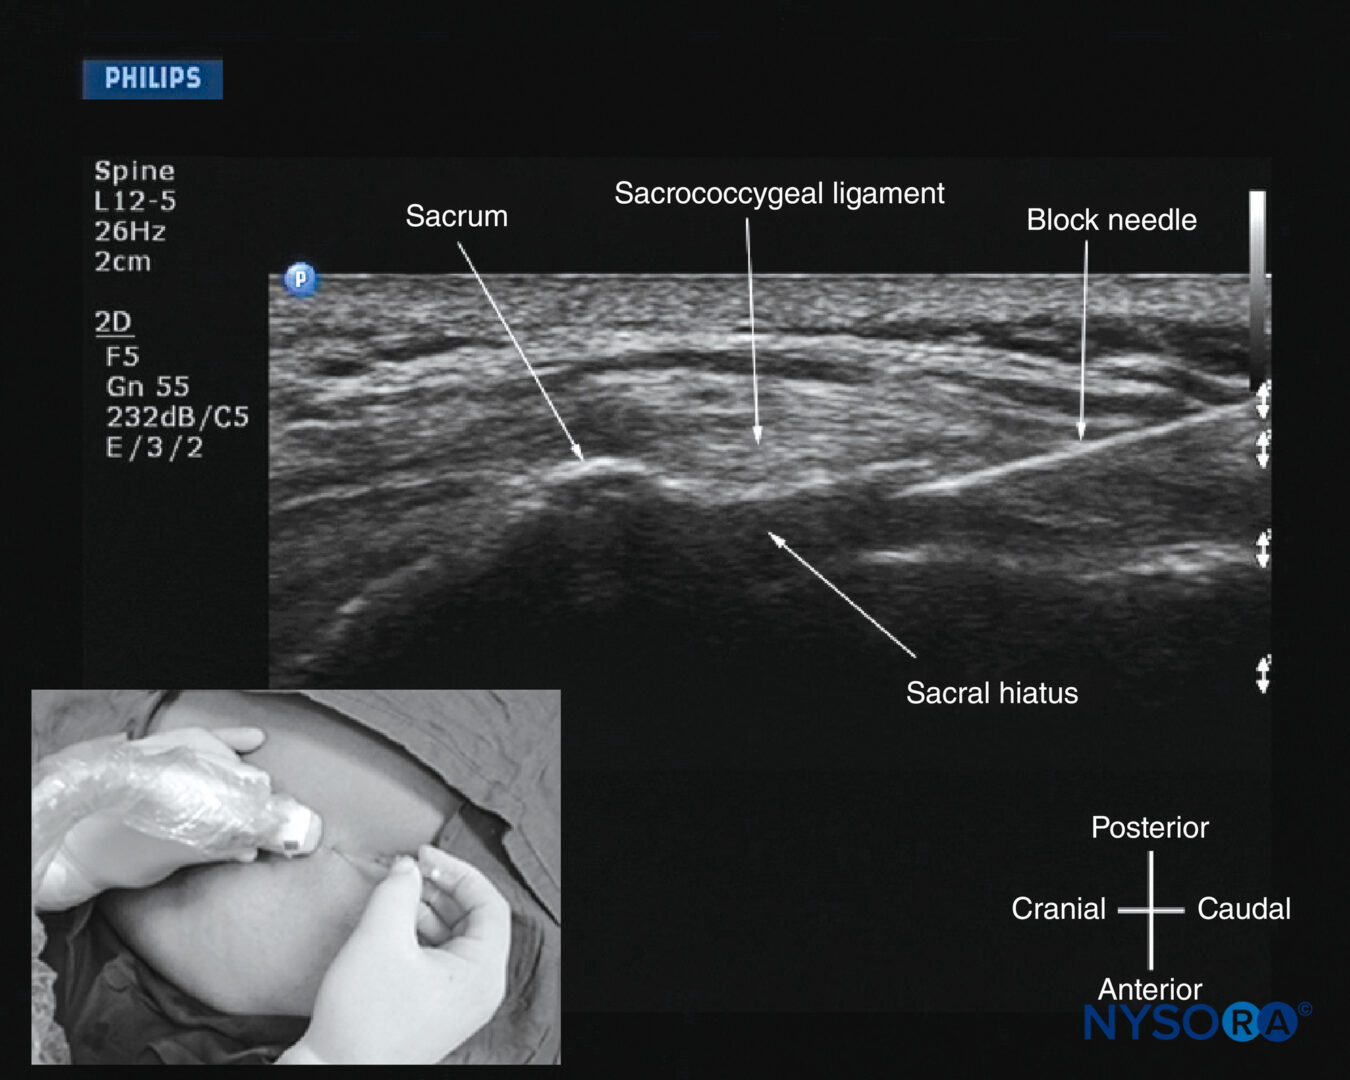
FIGURE 39. Sagittal sonogram of the sacrum at the level of the sacral hiatus during a real-time US-guided caudal epidural injection. Note the hyperechoic sacrococcygeal ligament and the block needle that has been inserted in the plane (in-plane) of the US beam. The inset image shows the position and orientation of the transducer and the direction in which the block needle was inserted.
Despite the ability to use the real-time US for establishing epidural access, visualization of an indwelling epidural catheter in adults has proved more challenging. Occasionally, anterior displacement of the posterior dura and widening of the posterior epidural space after an epidural bolus injection via the catheter can be observed and therefore used as a surrogate marker of the location of the catheter tip. Grau and colleagues postulated that this may be related to the small diameter and poor echogenicity of conventional epidural catheters. It remains to be seen whether the imminent development of echogenic epidural needles and catheters will have an impact on the ability to visualize epidurally placed catheters.
Thoracic Epidural Injection
There are limited published data on the use of US for thoracic epidural blocks. This lack may be due to the poor US visibility of the neuraxial structures in the thoracic region compared with the lumbar region (see above) and the associated technical difficulties. However, despite the narrow acoustic window, the lamina, interlaminar space, and posterior dura are visualized consistently when using the paramedian axis (see Figures 31, 32, 33, 34, and 35). The epidural space is more difficult to delineate, but it also is best visualized in a paramedian sagittal scan (see Figures 31 and 32). As a result, US can be used to perform a preprocedural scan or, as we have used it, to assist epidural access via the paramedian window. In the latter approach, the patient is positioned in the sitting position, and a PMSOS is performed at the desired thoracic level with the orientation marker of the transducer directed cranially.
Under strict aseptic precautions (described previously), the Tuohy needle is inserted via the paramedian axis in real time and in the plane of the US beam. The needle is advanced steadily until it makes contact with the lamina or enters the interlaminar space. At this point, the US transducer is removed, and a traditional loss-of-resistance-to-saline technique is used to access the epidural space. Because the lamina is relatively superficial in the thoracic region, it is possible to visualize the advancing Tuohy needle in real time. Preliminary experience with this approach indicates that US may improve the likelihood of thoracic epidural access on the first attempt. However, more research to compare the utility of a preprocedural scan or the US-assisted technique described above with the traditional approach is necessary before more definitive recommendations on the utility and safety of US for thoracic epidural injections can be made.
Caudal Epidural Injection
For a USG caudal epidural injection, a transverse (see Figure 36) or sagittal (see Figure 37) scan is performed at the level of the sacral hiatus. Because the sacral hiatus is a superficial structure, a high-frequency (13-6 MHz) linear array transducer is used for the scan as described previously. The needle can be inserted in the short (out-of-plane) or long (in-plane) axis. For a long-axis needle insertion, a sagittal scan is performed, and the passage of the block needle through the sacrococcygeal ligament into the sacral canal is visualized in real time (see Figure 39). However, because the sacrum impedes the passage of the US, there is a large acoustic shadow anteriorly, which makes it impossible to visualize the tip of the needle or the spread of the injectate within the sacral canal. An inadvertent intravascular injection, which reportedly occurs in 5%–9% of procedures, may not be detected using US. As a result, the clinician should still factor in traditional clinical signs such as the “pop” or “give” as the needle traverses the sacrococcygeal ligament, ease of injection, absence of subcutaneous swelling, “whoosh test,” nerve stimulation, or assessment of the clinical effects of the injected drug to confirm correct needle placement.
Color Doppler US can also be used to confirm the spread of the injectate inside the caudal epidural space. This is done by placing the color Doppler interrogation box over the acoustic window of the caudal canal in the sagittal sonogram while the injection is performed. Yoon and colleagues have reported that a correct injection deep to the sacrococcygeal ligament with unidirectional flow produces, in real time, a positive color spectrum change with one predominant color. In contrast, an inadvertent intravascular injection is seen as a multicolored spectrum. Chen and colleagues reported a 100% success rate in placing a caudal needle under US guidance as confirmed by contrast fluoroscopy. This report is encouraging, considering that, even in experienced hands, failure to place a needle in the caudal epidural space successfully is as high as 25%.
More recently, Chen and colleagues have described using US imaging as a screening tool during caudal epidural injections. In their cohort of patients, the mean diameter of the sacral canal at the sacral hiatus was 5.3 ± 2 mm, and the distance between the sacral cornua (bilateral) was 9.7 ± 1.9 mm. These researchers also identified that the presence of sonographic features such as a closed sacral hiatus and a sacral canal diameter of around 1.5 mm are associated with a greater probability of failure.
Based on the published data, it can be concluded that US guidance, despite its limitation, can be useful as an adjunct tool for caudal epidural needle placement and has the potential to improve technical outcomes, reduce failure rates and accidental intravascular injection, and minimize exposure to radiation in the chronic pain setting and therefore deserves further investigation.
CLINICAL UTILITY OF ULTRASOUND FOR CENTRAL NEURAXIAL BLOCKS
Outcome data on the use of US for CNB have primarily focused on the lumbar region. Most studies to date have evaluated the utility of a preprocedural US scan. A preprocedural scan allows the operator to identify the midline and accurately determine the interspace for needle insertion which is useful in patients in whom anatomical landmarks are difficult to palpate, such as in those with obesity edema of the back, or abnormal anatomy (eg, scoliosis, postlaminectomy surgery, or spinal instrumentation). It also allows the operator to preview the neuraxial anatomy, identify asymptomatic spinal abnormalities, such as in spina bifida, predict the depth to the epidural space, particularly in obese patients, identify ligamentum flavum defects, and determine the optimal site and trajectory for needle insertion.
Cumulative evidence suggests that a US examination performed before the epidural puncture improves the success rate of epidural access on the first attempt, reduces the number of puncture attempts or the need to puncture multiple levels, and also improves patient comfort during the procedure. A preprocedural scan can also be useful in patients presumed to have difficult epidural access, such as those with a history of difficult epidural access, obesity, or kyphosis or scoliosis of the lumbar spine. When used for obstetric epidural anesthesia, US guidance was reported to improve the quality of analgesia, reduce side effects, and improve patient satisfaction. A preprocedural scan may also improve the learning curve of students for epidural blocks in parturients. Currently, there are limited data on the utility of real-time US guidance for epidural access, although preliminary reports indicate that it may improve technical outcomes.
APPLICATIONS IN THE LUMBAR SPINE
Identification of Specific Lumbar Intervertebral Levels
The identification of lumbar intervertebral levels based on surface anatomical landmarks is often imprecise. In one study using MRI as the gold standard, the correct intervertebral level was identified in as few as 29% of patients. Other studies have repeatedly shown significant discordance between US and clinical determinations of lumbar intervertebral level. In an orthopedic population of 50 patients undergoing total joint arthroplasty, the palpated intercristal line corresponded to the L3–L4 level identified by US in 72%, to the L2–L3 level in 26%, and to the L4–L5 level in 2% of patients. In a similar study of 90 parturients, identification of the L3–L4 intervertebral space was concordant in only 53% of nonobese and 49% of obese patients. Of more concern was the fact that in 93% of the cases where there was disagreement, the clinically identified L3–L4 level corresponded to a higher (L1–L2 or L2–L3) level as identified by US.
This tendency was confirmed by two other studies of women who had received epidural anesthesia for labor analgesia. Both compared the documented epidural insertion level with a postpartum US assessment of the intervertebral level corresponding to the needle insertion scar. Once again, a high rate of discordance (45–63%) was observed between the two assessment methods, and the level of insertion according to US was more likely to be higher (72–76%) than that noted in the clinical record. The available evidence indicates that US is more accurate than clinical assessment of intervertebral level. In one study comparing clinical assessment, US, and the gold standard of lateral spine X-ray examination,39 clinical assessment accurately identified the L2–L3 interspace only 30% of the time, with an additional 7% of markings placed over the immediately adjacent spinous processes.
US correctly identified the L2–L3 interspace in 60% of cases, with a further 24% of markings placed over the immediately adjacent spinous processes. It should be noted that the margin of error with US was at most either one space above (9%) or below (7%) the intended target. In contrast, the clinical assessment showed greater variability, with margins of error up to two spaces higher (9%) or lower (18%). Furthermore, clinical assessment of intervertebral level was deemed impossible in 4% of cases compared to none when US was used.
FACILITATING THE TECHNICAL PERFORMANCE OF SPINAL AND EPIDURAL ANESTHESIA
Measuring Depth to the Epidural and Intrathecal Spaces
Cork et al. provided one of the first reports of the use of US to assist in epidural anesthesia. Despite relatively primitive US equipment, they were able to identify and measure the depth to the ligamentum flavum using a longitudinal neuraxial scan in 33 of 36 patients. They found a high correlation (r = 0.98) between measured depth by US and needle depth to the epidural space. In a subsequent study, Currie et al. also found a high correlation (r = 0.96) between US measured depth to the lamina in the PMSO view and needle insertion depth to the epidural space. The transverse interspinous view may also be used to measure the depth to the epidural space.
A high correlation between the measured depth to the posterior complex and needle insertion depth has been observed in both obese and nonobese parturients undergoing labor epidural analgesia (r = 0.85–0.88) and has been consistently demonstrated in a large number of studies. A recent meta-analysis identified 13 studies, involving 875 patients, that specifically addressed the correlation between US-measured depth and actual needle insertion depth. They confirmed that the correlation was high, regardless of which US view was used, with a pooled correlation coefficient of 0.91. The difference between US-measured depth and needle insertion depth in most trials is quite small (approximately 0.5 cm or less), with US usually underestimating needle depth. This difference is commonly attributed to soft-tissue compression by the US transducer during the scan.
Reducing the Number of Needle Passes Required for Block Success
In an early 2001 study of preprocedural US, Grau et al.15 randomized 72 parturients with difficult anatomy to surface landmark–guided or US-assisted epidural placement. Patients had either a history of difficult epidural, kyphoscoliosis or a body mass index (BMI) of more than 33 kg/m2. In this population, needle entry into the epidural space in the surface landmark– guided group required a mean of 2.6 puncture attempts compared to 1.5 in the US-assisted group (p < 0.001). More recently, Chin et al. evaluated an older population of 120 orthopedic patients with clinical predictors of difficult neuraxial block, including a BMI of more than 35 kg/m2, scoliosis, and prior lumbar surgery. Patients were randomized to either surface landmark–guided or US-assisted spinal anesthesia.
US halved the median number of needle insertions from 2 to 1 and significantly reduced the need for additional needle passes (6 vs. 13). Improved performance of neuraxial block after preprocedural ultrasound imaging is seen even in patients without predictors of technical difficulty. In a randomized controlled trial by Grau et al. of epidural analgesia in 300 parturients, the mean number of needle passes was significantly lower with the use of US compared to surface landmarks alone (1.3 vs. 2.2). These findings were validated in a later study by Vallejo et al., who randomized 15 first-year anesthesia trainees to perform 370 labor epidurals with or without the assistance of preprocedural US imaging. Once again, fewer insertion attempts were required in the US-guided group of patients (median of 1 vs. 2). Most recently, two separate systematic reviews of the available literature have confirmed these findings.
Shaikh et al. compared US-guided and non–US-guided neuraxial procedures, including diagnostic lumbar punctures as well as epidural and spinal anesthetics. They identified 14 publications, involving 1334 patients, that met their inclusion criteria. They found that the use of US significantly reduced both skin punctures and needle redirections required for successful CNB. Perlas et al. performed a similar systematic review of studies involving the use of US for lumbar CNB and lumbar puncture in adults. They identified 14 randomized controlled trials that met inclusion criteria, six of which were newer and had not been included in the previous systematic review. Once again, they found that US significantly reduced the overall number of needle passes required for procedural success.
Improved Block Success and Epidural Efficacy
In addition to reducing the technical difficulty of epidural needle insertion, US may also increase the efficacy of labor epidural analgesia. In two separate randomized controlled trials by Grau et al., there was a significant reduction in the rate of incomplete analgesia (2% vs. 8%) in one study and epidural failure (0% vs. 5.6%) in the other. In addition, a small but statistically significant decrease in post-block pain scores was noted in the US-assisted groups compared to the surface landmark–guided groups. These findings may be partially explained by observed reductions in the incidences of asymmetric and patchy blocks.
It is notable that the more recent study by Vallejo et al., involving multiple operators, observed a similarly impressive reduction in the epidural failure rate in the US-assisted group (1.6% vs. 5.5%). Systematic reviews have provided further evidence that US increases block success. Shaikh et al. found that the use of US reduced the risk of procedural failure by 79%, with a number needed to treat (NNT) to avoid one failure of 16. A subgroup analysis of intrathecal (relative risk [RR] = 0.19) and epidural (RR = 0.23) procedures confirmed that this effect is similar for both. The findings of Perlas et al. were similar, although more modest in magnitude, with a risk reduction of 49% and an NNT of 34 for procedural failure.
Effect on Procedure Time
In their early evaluations of US-assisted lumbar epidural insertion, Grau et al. reported that US scanning added only 60–75 seconds to the preparation time. Similarly, in their large randomized controlled trial of labor epidural insertion by trainees, Vallejo et al. reported that the use of US increased average total procedure time by 60 seconds. The caveat here is that these studies involved a single experienced sonographer and a cohort of healthy obstetric patients with normal anatomy. More time may be required in less-experienced hands or in patients with difficult spinal anatomy. Chin et al. found that in patients with scoliosis, prior lumbar surgery, or a BMI of more than 35 kg/m2 , preprocedural scanning took 6.7 minutes on average to complete compared to 0.6 minutes for palpation of surface landmarks alone. However, this difference was partially offset by a decrease in time taken to perform the spinal anesthetic (5.0 vs. 7.3 minutes).
Reducing the Risk of Complications
US may potentially reduce adverse effects related to neuraxial anesthesia. Grau et al. observed a significant reduction in the rate of postpartum headache (4.7% vs. 18.7%) and backache (14.7% vs. 22.0%) with US-assisted epidural insertion. The risk of inadvertent dural puncture may also be reduced by the ability to measure the depth to the epidural space. With regard to more serious complications, although there is no direct supporting evidence, the decreased technical difficulty associated with US suggests that it may theoretically reduce risk in a number of ways. Conus medullaris injuries from spinal needles inserted at a level much higher than intended by the anesthesiologist have been reported.
Improved accuracy of intervertebral level identification could reduce the risk of this rare but potentially devastating outcome. Spinal hematoma and persistent neurological deficit are similarly rare but important complications. Technical difficulty in performing the block has been identified as an associated risk factor for both these complications thus, preprocedural US has the potential to reduce their incidence. This is supported by the recent meta-analysis by Shaikh et al.20 of US-guided versus non–US-guided procedures, which found a 73% reduction in the risk of traumatic procedures with the use of US.
Predicting the Feasibility and Ease of Performing Neuraxial block
In addition to assisting the technical performance of neuraxial block, US may also be used as a preoperative assessment tool to guide decision making. This has been illustrated in two case reports. The first involved a patient who had a history of L3–L5 spinal decompression and fusion with corresponding hardware in situ and who had experienced two previous failed attempts at a spinal anesthetic. Preprocedural US determined that there was, in fact, a patent acoustic window at the L3–L4 level, which, due to dense overlying scar tissue, could be penetrated only by a larger-gauge (22-gauge) Quincke-tip spinal needle. The second involved a patient with severe ankylosing spondylitis and a history of failed spinal anesthesia despite persistent efforts by multiple experienced operators.
Here, a US scan in the preanesthetic clinic identified an acoustic window at L4–L5, which allowed planning for a spinal anesthetic that was successfully performed at that level on the day of surgery. The potential of using US to predict the ease of performing spinal anesthesia has been evaluated in two cohort studies. These were based on the premise that the ability to visualize the vertebral canal should correspond to the size of the interlaminar space, thus reflecting the ease with which it may be penetrated. Weed et al. performed preprocedural US scans using the PMSO view in 60 orthopedic patients and documented the quality of the images obtained.
Clinicians blinded to the results of the imaging performed spinal anesthesia using a surface landmark–guided approach. There was a remarkable difference in block performance between patients in whom the anterior complex was visible on US (a good image) and those in whom it was not (a poor image). When images were poor, the median number of needle passes required was 10 compared to 4 in patients with good images. Spinal anesthesia was classified as difficult by the operator in 9% of patients with good images compared to 50% of patients with poor images of the anterior complex. The positive predictive value of a poor image in the PMSO view for difficult spinal anesthesia was calculated to be 82.3%, with the negative predictive value 67.4%.
In the second study, Chin et al. studied the ability of both the PMSO and transverse interspinous views to predict difficult spinal anesthesia in a cohort of 100 orthopedic patients. As in the study by Weed et al., the anesthesiologists performing the spinal anesthetic were blinded to the results of imaging. If both posterior and anterior complexes were visible (a good-quality view) in the transverse interspinous view, the positive predictive value for absence of technical difficulty at that level was 85%. This discriminative ability was not present, however, with the PMSO view, which may be explained by the fact that a midline needle approach was used in all cases. There were a small number of patients in whom spinal anesthesia was challenging despite a good-quality transverse median (TM) view of the vertebral canal. The authors hypothesized that this could have been avoided if the preprocedure US scan had been used to guide the spinal procedure, as would be the case in the clinical setting.
APPLICATIONS IN THE THORACIC SPINE
Identification of Thoracic Intervertebral Levels
As in the lumbar spine, clinical methods of identifying thoracic intervertebral levels based on surface anatomical landmarks have been shown to be inaccurate when referenced to the gold standard of MRI or X-ray imaging. In one study, the T7 spinous process was accurately identified only 29% of the time by counting down from the vertebra prominens (C7) and only 10% of the time when the inferior tip of the scapula was used as the primary landmark. The majority of errors tended to be in the caudad direction. The accuracy of US in identifying thoracic intervertebral levels has not been verified against a gold-standard imaging modality; however, Arzola et al. have demonstrated a similar lack of agreement between US identification of thoracic intervertebral level (using a counting-up method from the sacrum and twelfth rib) and surface anatomical landmarks. As with the earlier studies, the vertebra prominens was a more accurate landmark for C7 (58% agreement) than the inferior angle of the scapula was for T7 (36% agreement). Errors in identifying T7 were most often in a caudad direction (83% of errors), whereas the errors in identifying C7 were equally distributed in a cephalad and caudad direction.
Determining the Depth to the Thoracic Epidural Space
Rasoulian et al. compared US measurement of the depth to the ligamentum flavum in the PMSO view to actual needle insertion depth in a small cohort of 20 patients receiving thoracic epidural analgesia. There was moderately good correlation (r2 = 0.65) observed between the two measurements, with US tending to underestimate needle insertion depth by a mean of 4.68 mm. It is notable that this correlation was similar to that obtained when CT measurement of the depth to the epidural space was compared to needle insertion depth (r2 = 0.69, mean difference of 4.49 mm). Similar results were reported by Salman et al. in another study of mid-to-lower thoracic epidural insertion in 35 adult patients using a paramedian approach. Correlation between US-measured depth and needle insertion depth was good (r2 = 0.75), and the mean difference was 7.1 mm, with US tending to underestimate the depth. These findings suggest that US is a useful tool for estimating depth to the thoracic epidural space.
Improving the Technical Performance of Thoracic Epidurals
The ability to delineate the underlying anatomy of the thoracic spine can potentially improve the technical performance of thoracic epidurals. However, unlike in the lumbar spine, there is presently limited evidence supporting the benefit of preprocedural US imaging in this regard. In the aforementioned study by Salman et al., the PMSO view on US was used to determine the optimal needle insertion point for a paramedian approach to mid-to-lower thoracic epidural insertion. Successful insertion was achieved with only one skin puncture on average and within two or fewer redirections in 88% of cases. In addition, case reports suggest that US is useful in evaluating abnormal anatomy and determining the optimal needle insertion site and trajectory in scoliotic patients.
EDUCATION AND TRAINING
Learning USG CNB techniques takes time and patience. Regardless of the technique used, USG CNB and, in particular, real-time USG CNB are advanced techniques and are by far the most difficult USG interventions. They demand a high degree of manual dexterity, hand–eye coordination, and an ability to conceptualize two-dimensional information into a 3D image. Therefore, before attempting to perform a USG CNB, the operator should have a sound knowledge of the basics of US, be familiar with image optimization, understand the sonoanatomy of the spine, and have the necessary interventional skills. It is advisable to start by attending a course or workshop tailored to this purpose where the operator can learn the basic scanning techniques, spinal sonoanatomy, and relevant interventional skills.
Further experience in spinal sonography can also be acquired by scanning human volunteers. Currently, there is paucity of data on what the minimum training requirement is to attain competence in spinal sonography or USG CNB. Preliminary data suggest that once the basic knowledge on US of the lumbar spine is attained, experience with 40 or more cases may be necessary to attain competence in scanning. Today, there are several models (phantoms) for learning spinal sonoanatomy and practicing USG central neuraxial interventions.
The water-based spine phantom is useful for learning the osseous anatomy of the spine, but it is not a good model for learning USG spinal interventions because it lacks tissuemimicking properties. Spinal sonography is often taught at workshops, but such workshops are not suitable for practicing actual techniques. Fresh cadaver courses are available, which allow participants to study neuraxial sonoanatomy and practice USG CNB with realistic haptic feedback, but they may be limited by the quality of the US images. Further, such courses are uncommon and conducted in anatomy departments with the cadavers in a position that rarely mimics what is practiced in the operating room.
Anesthetized pigs can also be used, but animal ethics approval is required and, for the organizers, a license from the local health department to conduct such workshops. This method entails infectious precautions, and religious beliefs may preclude its use as a model for some. Moreover, such workshops are conducted in designated animal laboratories that are typically small and not suited to accommodate large groups of participants. To circumvent some of these problems, the group at the Chinese University of Hong Kong recently introduced the pig carcass spine phantom (see Figure 12), an excellent model that can be used in conference venues and provides excellent tactile and visual feedback.
The limitation of the pig carcass spine phantom is that it is a decapitated model, and there is loss of cerebrospinal fluid during the preparation process. This presentation results in air artifacts and loss of contrast within the spinal canal during spinal sonography unless the thecal sac is cannulated at its cranial end and continuously irrigated with fluid (normal saline), a process that requires surgical dissection to isolate the thecal sac. Therefore, an “in vitro” model that can facilitate the learning of the scanning techniques and the hand–eye coordination skills required for real-time USG CNB is highly desirable. A low-cost gelatin-based US phantom of the lumbosacral spine has been recently proposed.
However, the gelatin phantom is soft in consistency, lacks tissue-mimicking echogenic properties, does not provide haptic feedback, is easily contaminated with mold and bacteria, and is limited in its usefulness by needle track marks, all of which preclude its extended use. Karmakar and colleagues have recently developed a gelatin– agar spine phantom (see Figure 11) that overcomes some of the drawbacks of the gelatin-based spine phantom. It is mechanically stable, has a tissue-like texture and echogenicity, needle track marks are less of a problem, and it can be used over extended periods of time to study the osseous anatomy of the lumbosacral spine and to practice the hand–eye coordination skills required to perform USG CNB.
Although a variety of spine phantoms have been described to learn the scanning and needle insertion techniques in the workshop setting, none of these have undergone scrutiny to determine how effective they are for transferring the knowledge and skills necessary for USG CNB. Once the basic knowledge and skills are attained, it is best to start by performing USG spinal injections, under supervision, before progressing to performing epidural blocks. Real-time USG epidurals can be technically challenging, even for an experienced operator, and it is our opinion that it is not practical in the clinical setting or for everyday use.
In contrast, a preprocedural scan is simple to perform and provides valuable information that can translate into improved technical outcomes during a CNB and may be the prudent approach to using US for CNBs. That said, real-time US guidance might be the only way out, for safety, in patients with difficult backs (eg, those with scoliosis, ankylosing spondylitis, or instrumented or operated backs). Therefore, the skills necessary to perform real-time USG CNBs must be developed as part of one’s ongoing skill development. If it is not possible to gain experience in USG CNB locally, it is advisable to visit a center where such interventions are practiced.
SUMMARY
USG CNB is a rapidly developing alternative to traditional landmark-based techniques. It is noninvasive, safe, can be quickly performed, does not involve exposure to radiation, provides real-time images, and is free from adverse effects. Experienced sonographers can visualize neuraxial structures with satisfactory clarity using US. A preprocedural scan allows the operator to preview the spinal anatomy, identify the midline, locate a given intervertebral level, accurately predict the depth to the epidural space, and determine the optimal site and trajectory for needle insertion. A preprocedural scan may also be used to predict the feasibility and ease of performing CNBs.
The use of US also improves the success rate of epidural access on the first attempt, reduces the number of puncture attempts or the need to puncture multiple levels, and improves patient comfort during the procedure. US is an excellent teaching tool for demonstrating the anatomy of the spine and improves the learning curve for the performance of epidural blocks in parturients. US guidance also may allow the use of CNB in patients who in the past may have been considered unsuitable for such procedures due to abnormal spinal anatomy. However, US guidance for CNB is still in its early stages of development; the evidence to support its use is sparse but in favor of its use as a preprocedural imaging tool.
Furthermore, initial experience with real-time USG CNB indicates that it is technically demanding and, therefore, unlikely to replace traditional methods of performing CNB in the near future because traditional methods are well established as safe, simple, and effective in most patients. As US technology continues to improve and as skills necessary to perform USG interventions become more widely available, the use of US for CNB may become the standard of care in the future.
READ MORE about Neuraxial Blocks at this link on NYSORA: Infection Control in Regional Anesthesia
REFERENCES
- Cook TM, Counsell D, Wildsmith JA: Major complications of central neuraxial block: report on the Third National Audit Project of the Royal College of Anaesthetists. Br J Anaesth 2009;102:179–190.
- Stiffler KA, Jwayyed S, Wilber ST, Robinson A: The use of ultrasound to identify pertinent landmarks for lumbar puncture. Am J Emerg Med 2007;25:331–334.
- Hogan QH: Tuffier’s line: the normal distribution of anatomic parameters. Anesth Analg 1994;78:194–195.
- Broadbent CR, Maxwell WB, Ferrie R, Wilson DJ, Gawne-Cain M, Russell R: Ability of anaesthetists to identify a marked lumbar interspace. Anaesthesia 2000;55:1122–1126.
- Furness G, Reilly MP, Kuchi S: An evaluation of ultrasound imaging for identification of lumbar intervertebral level. Anaesthesia 2002;57: 277–280.
- Holmaas G, Frederiksen D, Ulvik A, Vingsnes SO, Ostgaard G, Nordli H: Identification of thoracic intervertebral spaces by means of surface anatomy: a magnetic resonance imaging study. Acta Anaesthesiol Scand 2006;50:368–373.
- Reynolds F: Damage to the conus medullaris following spinal anaesthesia. Anaesthesia 2001;56:238–247.
- Hamandi K, Mottershead J, Lewis T, Ormerod IC, Ferguson IT: Irreversible damage to the spinal cord following spinal anesthesia. Neurology 2002;59:624–626.
- Seeberger MD, Lang ML, Drewe J, Schneider M, Hauser E, Hruby J: Comparison of spinal and epidural anesthesia for patients younger than 50 years of age. Anesth Analg 1994;78:667–673.
- Tarkkila P, Huhtala J, Salminen U: Difficulties in spinal needle use. Insertion characteristics and failure rates associated with 25-, 27- and 29-gauge Quincke-type spinal needles. Anaesthesia 1994;49:723–725.
- Chin KJ, Karmakar MK, Peng P: Ultrasonography of the adult thoracic and lumbar spine for central neuraxial block. Anesthesiology 2011;114:1459–1485.
- Karmakar MK, Li X, Ho AM, Kwok WH, Chui PT: Real-time ultrasound-guided paramedian epidural access: evaluation of a novel in-plane technique. Br J Anaesth 2009;102:845–854.
- Carvalho JC: Ultrasound-facilitated epidurals and spinals in obstetrics. Anesthesiol Clin 2008;26:145–158.
- Chin KJ, Ramlogan R, Arzola C, Singh M, Chan V: The utility of ultrasound imaging in predicting ease of performance of spinal anesthesia in an orthopedic patient population. Reg Anesth Pain Med 2013;38: 34–38.
- Grau T, Leipold RW, Conradi R, Martin E: Ultrasound control for presumed difficult epidural puncture. Acta Anaesthesiol Scand 2001;45: 766–771.
- Grau T, Leipold RW, Conradi R, Martin E, Motsch J: Ultrasound imaging facilitates localization of the epidural space during combined spinal and epidural anesthesia. Reg Anesth Pain Med 2001;26:64–67.
- Grau T, Leipold RW, Conradi R, Martin E, Motsch J: Efficacy of ultrasound imaging in obstetric epidural anesthesia. J Clin Anesth 2002;14:169–175.
- Grau T, Leipold RW, Fatehi S, Martin E, Motsch J: Real-time ultrasonic observation of combined spinal-epidural anaesthesia. Eur J Anaesthesiol 2004;21:25–31.
- Perlas A, Chaparro LE, Chin KJ: Lumbar neuraxial ultrasound for spinal and epidural anesthesia: a systematic review and meta-analysis. Reg Anesth Pain Med 2016;41:251–260.
- Shaikh F, Brzezinski J, Alexander S, et al: Ultrasound imaging for lumbar punctures and epidural catheterisations: systematic review and metaanalysis. BMJ 2013;346:f1720.
- Mathieu S, Dalgleish DJ: A survey of local opinion of NICE guidance on the use of ultrasound in the insertion of epidural catheters. Anaesthesia 2008;63:1146–1147.
- Bogin IN, Stulin ID: Application of the method of 2-dimensional echospondylography for determining landmarks in lumbar punctures. Zh Nevropatol Psikhiatr Im S S Korsakova 1971;71:1810–1811.
- Porter RW, Wicks M, Ottewell D: Measurement of the spinal canal by diagnostic ultrasound. J Bone Joint Surg Br 1978;60-B:481–484.
- Cork RC, Kryc JJ, Vaughan RW: Ultrasonic localization of the lumbar epidural space. Anesthesiology 1980;52:513–516.
- Currie JM: Measurement of the depth to the extradural space using ultrasound. Br J Anaesth 1984;56:345–347.
- Wallace DH, Currie JM, Gilstrap LC, Santos R: Indirect sonographic guidance for epidural anesthesia in obese pregnant patients. Reg Anesth 1992;17:233–236.
- Grau T, Leipold RW, Horter J, Conradi R, Martin EO, Motsch J: Paramedian access to the epidural space: the optimum window for ultrasound imaging. J Clin Anesth 2001;13:213–217.
- Grau T, Leipold RW, Delorme S, Martin E, Motsch J: Ultrasound imaging of the thoracic epidural space. Reg Anesth Pain Med 2002;27:200–206.
- Grau T, Bartusseck E, Conradi R, Martin E, Motsch J: Ultrasound imaging improves learning curves in obstetric epidural anesthesia: a preliminary study. Can J Anaesth 2003;50:1047–1050.
- Grau T: The evaluation of ultrasound imaging for neuraxial anesthesia. Can J Anaesth 2003;50:R1–R8.
- Karmakar MK: Ultrasound for central neuraxial blocks. Tech Reg Anesth Pain Manag 2009;13:161–170.
- Karmakar MK, Li X, Kwok WH, Ho AM, Ngan Kee WD: Sonoanatomy relevant for ultrasound-guided central neuraxial blocks via the paramedian approach in the lumbar region. Br J Radiol 2012;85:e262–e269.
- Saifuddin A, Burnett SJ, White J: The variation of position of the conus medullaris in an adult population. A magnetic resonance imaging study. Spine (Phila Pa 1976) 1998;23:1452–1456.
- MacDonald A, Chatrath P, Spector T, Ellis H: Level of termination of the spinal cord and the dural sac: a magnetic resonance study. Clin Anat 1999;12:149–152.
- Karmakar, MK, Li X, Kwok WH, Ho AM, Ngan Kee WD: The “waterbased spine phantom”—a small step towards learning the basics of spinal sonography [letter]. Br J Anaesth March 12, 2009. Available from: http:// bja.oxfordjournals.org/forum/topic/brjana_el%3B4114.
- Bellingham GA, Peng PWH: A low-cost ultrasound phantom of the lumbosacral spine. Reg Anesth Pain Med 2010;35:290–293.
- Kwok WH, Chui PT, Karmakar MK: The pig carcass spine phantom—a model to learn ultrasound guided neuraxial interventions. Reg Anesth Pain Med 2010;35:472–473.
- Greher M, Scharbert G, Kamolz LP, et al: Ultrasound-guided lumbar facet nerve block: a sonoanatomic study of a new methodologic approach. Anesthesiology 2004;100:1242–1248.
- Furness G, Reilly MP, Kuchi S: An evaluation of ultrasound imaging for identification of lumbar intervertebral level. Anaesthesia 2002;57: 277–280.
- Avramescu S, Arzola C, Tharmaratnam U, Chin KJ, Balki M: Sonoanatomy of the thoracic spine in adult volunteers. Reg Anesth Pain Med 2012;37:349–353.
- Karmakar MK, Ho AM, Li X, Kwok WH, Tsang K, Kee WD: Ultrasound-guided lumbar plexus block through the acoustic window of the lumbar ultrasound trident. Br J Anaesth 2008;100:533–537.
- Suzuki S, Yamamuro T, Shikata J, Shimizu K, Iida H: Ultrasound measurement of vertebral rotation in idiopathic scoliosis. J Bone Joint Surg Br 1989;71:252–255.
- Chen CP, Tang SF, Hsu TC, et al: Ultrasound guidance in caudal epidural needle placement. Anesthesiology 2004;101:181–184.
- Balki M, Lee Y, Halpern S, Carvalho JC: Ultrasound imaging of the lumbar spine in the transverse plane: the correlation between estimated and actual depth to the epidural space in obese parturients. Anesth Analg 2009;108:1876–1881.
- Chin KJ, Perlas A, Singh M, et al: An ultrasound-assisted approach facilitates spinal anesthesia for total joint arthroplasty. Can J Anaesth 2009;56:643–650.
- Pintaric TS, Hadzic A, Strbenc M, Podpecan O, Podbregar M, Cvetko E: Inflammatory response after injection of aqueous gel into subarachnoid space in piglets. Reg Anesth Pain Med 2013;38:100–105.
- Costello JF, Balki M: Cesarean delivery under ultrasound-guided spinal anesthesia [corrected] in a parturient with poliomyelitis and Harrington instrumentation. Can J Anaesth 2008;55:606–611.
- Prasad GA, Tumber PS, Lupu CM: Ultrasound guided spinal anesthesia. Can J Anaesth 2008;55:716–717.
- Coley BD, Shiels WE, Hogan MJ: Diagnostic and interventional ultrasonography in neonatal and infant lumbar puncture. Pediatr Radiol 2001;31:399–402.
- Peterson MA, Abele J: Bedside ultrasound for difficult lumbar puncture. J Emerg Med 2005;28:197–200.
- Chin KJ, Chan VW, Ramlogan R, Perlas A: Real-time ultrasound-guided spinal anesthesia in patients with a challenging spinal anatomy: two case reports. Acta Anaesthesiol Scand 2010;54:252–255.
- Yamauchi M, Honma E, Mimura M, Yamamoto H, Takahashi E, Namiki A: Identification of the lumbar intervertebral level using ultrasound imaging in a post-laminectomy patient. J Anesth 2006;20:231–233.
- Yeo ST, French R: Combined spinal-epidural in the obstetric patient with Harrington rods assisted by ultrasonography. Br J Anaesth 1999;83:670–672.
- Rapp HJ, Folger A, Grau T: Ultrasound-guided epidural catheter insertion in children. Anesth Analg 2005;101:333–339, table.
- Salman A, Arzola C, Tharmaratnam U, Balki M: Ultrasound imaging of the thoracic spine in paramedian sagittal oblique plane: the correlation between estimated and actual depth to the epidural space. Reg Anesth Pain Med 2011;36:542–547.
- Yoon JS, Sim KH, Kim SJ, Kim WS, Koh SB, Kim BJ: The feasibility of color Doppler ultrasonography for caudal epidural steroid injection. Pain 2005;118:210–214.
- Tsui BC, Tarkkila P, Gupta S, Kearney R: Confirmation of caudal needle placement using nerve stimulation. Anesthesiology 1999;91:374–378.
- Chen CP, Wong AM, Hsu CC, et al: Ultrasound as a screening tool for proceeding with caudal epidural injections. Arch Phys Med Rehabil 2010;91:358–363.
- McLeod A, Roche A, Fennelly M: Case series: ultrasonography may assist epidural insertion in scoliosis patients. Can J Anaesth 2005;52:717–720.
- Arzola C, Davies S, Rofaeel A, Carvalho JC: Ultrasound using the transverse approach to the lumbar spine provides reliable landmarks for labor epidurals. Anesth Analg 2007;104:1188–1192, tables.
- Asakura Y, Kandatsu N, Hashimoto A, Kamiya M, Akashi M, Komatsu T: Ultrasound-guided neuroaxial anesthesia: accurate diagnosis of spina bifida occulta by ultrasonography. J Anesth 2009;23:312–313.
- Lee Y, Tanaka M, Carvalho JC: Sonoanatomy of the lumbar spine in patients with previous unintentional dural punctures during labor epidurals. Reg Anesth Pain Med 2008;33:266–270.
- Chin KJ, Perlas A, Chan V, Brown-Shreves D, Koshkin A, Vaishnav V: Ultrasound imaging facilitates spinal anesthesia in adults with difficult surface anatomic landmarks. Anesthesiology 2011;115:94–101.
- Locks GF, Almeida MC, Pereira AA: Use of the ultrasound to determine the level of lumbar puncture in pregnant women. Rev Bras Anestesiol 2010;60:13–19.
- Schlotterbeck H, Schaeffer R, Dow WA, Touret Y, Bailey S, Diemunsch P: Ultrasonographic control of the puncture level for lumbar neuraxial block in obstetric anaesthesia. Br J Anaesth 2008;100:230–234.
- Whitty R, Moore M, Macarthur A: Identification of the lumbar interspinous spaces: palpation versus ultrasound. Anesth Analg 2008; 106:538–540, table.
- Gnaho A, Nguyen V, Villevielle T, Frota M, Marret E, Gentili ME: Assessing the depth of the subarachnoid space by ultrasound. Rev Bras Anestesiol 2012;62:520–530.
- Grau T, Leipold R, Conradi R, Martin E, Motsch J: [Ultrasonography and peridural anesthesia. Technical possibilities and limitations of ultrasonic examination of the epidural space]. Anaesthesist 2001;50:94–101.
- Tran D, Kamani AA, Lessoway VA, Peterson C, Hor KW, Rohling RN: Preinsertion paramedian ultrasound guidance for epidural anesthesia. Anesth Analg 2009;109:661–667.
- Vallejo MC, Phelps AL, Singh S, Orebaugh SL, Sah N: Ultrasound decreases the failed labor epidural rate in resident trainees. Int J Obstet Anesth 2010;19:373–378.
- de Seze MP, Sztark F, Janvier G, Joseph PA: Severe and long-lasting complications of the nerve root and spinal cord after central neuraxial block. Anesth Analg 2007;104:975–979.
- Vandermeulen EP, Van AH, Vermylen J: Anticoagulants and spinalepidural anesthesia. Anesth Analg 1994;79:1165–1177.
- Chin KJ, Chan V: Ultrasonography as a preoperative assessment tool: predicting the feasibility of central neuraxial block. Anesth Analg 2010;110:252–253.
- Weed JT, Taenzer AH, Finkel KJ, Sites BD: Evaluation of pre-procedure ultrasound examination as a screening tool for difficult spinal anaesthesia*. Anaesthesia 2011;66:925–930.
- Stonelake PS, Burwell RG, Webb JK: Variation in vertebral levels of the vertebra prominens and sacral dimples in subjects with scoliosis. J Anat 1988;159:165–172.
- Teoh DA, Santosham KL, Lydell CC, Smith DF, Beriault MT: Surface anatomy as a guide to vertebral level for thoracic epidural placement. Anesth Analg 2009;108:1705–1707.
- Arzola C, Avramescu S, Tharmaratnam U, Chin KJ, Balki M: Identification of cervicothoracic intervertebral spaces by surface landmarks and ultrasound. Can J Anaesth 2011;58:1069–1074.
- Rasoulian A, Lohser J, Najafi M, et al: Utility of prepuncture ultrasound for localization of the thoracic epidural space. Can J Anaesth 2011;58: 815–823.
- Pandin P, Haentjens L, Salengros JC, Quintin J, Barvais L: Combined ultrasound and nerve stimulation-guided thoracic epidural catheter placement for analgesia following anterior spine fusion in scoliosis. Pain Pract 2009;9:230–234.
- Margarido CB, Arzola C, Balki M, Carvalho JC: Anesthesiologists’ learning curves for ultrasound assessment of the lumbar spine. Can J Anaesth 2010;57:120–126.
- Halpern SH, Banerjee A, Stocche R, Glanc P: The use of ultrasound for lumbar spinous process identification: a pilot study. Can J Anaesth 2010; 57:817–822.
- Chin KJ, Tse CC, Chan V: Practical considerations in preparing the pig carcass spine phantom. Reg Anesth Pain Med 2011;36:91–92.
- Li JW, Karmakar MK, Li X, Kwok WH, Ngan Kee WD: Gelatin-agar lumbosacral spine phantom: a simple model for learning the basic skills required to perform real-time sonographically guided central neuraxial blocks. J Ultrasound Med 2011;30:263–72.
Manoj K. Karmakar and Ki Jinn Chin