


The safety and efficacy of ultrasound (US)-guided nerve block relies heavily upon a comprehensive understanding of machine “knobology” [1–3]. Despite differences in appearance and layout, all US machines share the same basic operative functions that users must appreciate in order to optimize the image. While modern US machines offer an abundance of features, the basic functions that all operators should be familiar with are frequency and probe selection, depth, gain, time gain compensation (TGC), focus, preprogrammed presets, color Doppler, power Doppler, compound imaging, tissue harmonic imaging (THI) (on some models), and image freeze and acquisition. Once the physical principles of US are understood, it becomes clear that creating the “best” image is often a series of trade-offs between improving one function at the expense of another. Each of the aforementioned functions is presented in turn below, following the sequence we use when performing any US-guided intervention.
1. FREQUENCY AND PROBE SELECTION
Selecting the appropriate frequency of the emitted US wave is perhaps the most crucial of all adjustments. Ultrasound waves are characterized by a specific frequency (f) and wave length (λ), as described by the equation v = f × λ, where v is the speed at which the wave travels (all machines assume that US waves travel through soft tissue at 1540 m/s). The range of frequencies used for nerve blocks is between 3 and 15 MHz. Higher frequencies provide superior axial resolution (Fig. 1).
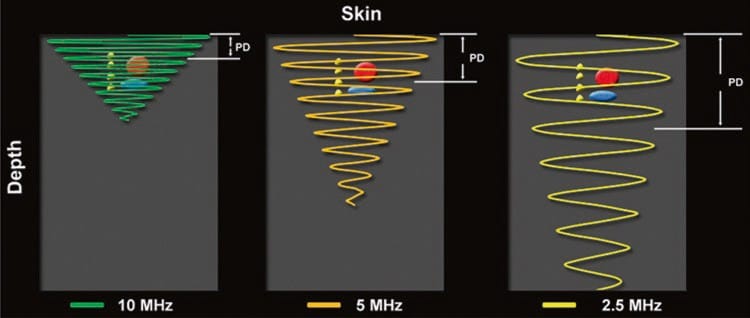
Fig.1 Higher ultrasound frequencies produce shorter pulse durations which promote improved axial resolution. The opposite is true when lower frequencies are used
Conceptually, axial resolution enables differentiation between structures lying close together at different depths (y-axis) within the ultrasound image, that is, above and below one another. Poor axial resolution, or inappropriately low frequency, may mislead by producing only one structure on the US image when, in reality, there are two structures lying immediately above and below each other (Fig. 2).
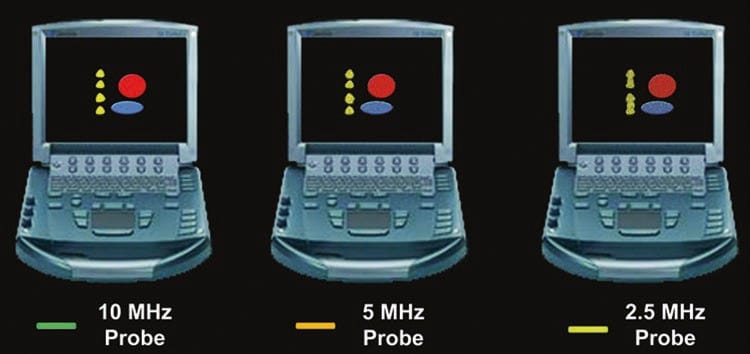
Fig.2 Axial resolution denotes the ability of the ultrasound machine to visually separate two structures lying atop one another (y-axis) in a direction parallel to the beam. As frequency increases, axial resolution increases, but depth of penetration decreases. Low-frequency waves
Unfortunately, higher frequency waves are attenuated more than lower frequency waves. Attenuation, which is described in more detail below (see “Time Gain Compensation”), refers to the progressive loss of energy (i.e., signal intensity) as the US wave travels from the probe to the target tissue and back to the probe again for processing into an image (Fig. 3) [1]. The end result of excess attenuation is an indiscernible image. The operator must therefore choose the highest possible frequency while still being able to penetrate to the appropriate depth in order to visualize the target. High-frequency transducers are best for depths of up to 3–4 cm; thereafter, a lower frequency probe is often necessary.
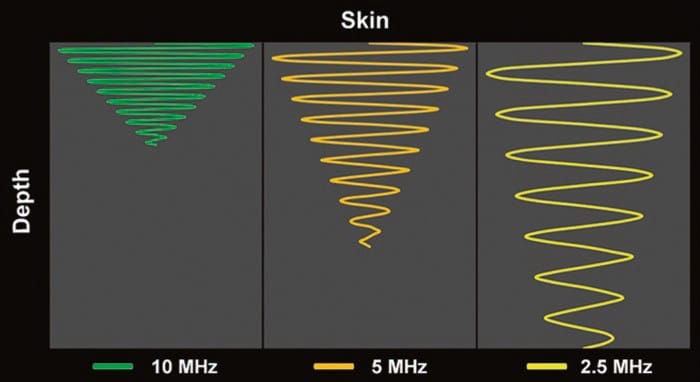
Fig.3 Attenuation varies directly with the frequency of the ultrasound wave and the distance traveled by the ultrasound wave. Note how the higher frequency (10 MHz) ultrasound wave is more attenuated relative to the lower frequency (5 and 2.5 MHz) wave(s) at any given distance (depth)
Probe categories can be divided into high (8–12 MHz), medium (6–10 MHz), and low (2–5 MHz) frequency ranges. On some machines, a variety of probes are always connected, and choosing the desired probe requires only the toggle of a selector switch. On other machines, the different probes must be physically removed and attached each time. Most US probes have a “central” (i.e., optimal) frequency as well as a range of frequencies on either side of this central frequency, known as the bandwidth. After choosing the appropriate probe, the operator may therefore fine tune the frequency of the US wave emitted from the transducer by actively selecting only the upper, mid, or lower frequencies from each transducer’s bandwidth.
2. DEPTH
The depth setting must be adjusted so that the structures of interest fall within the field of view (Fig. 4). The objective is to set the depth to just below the desired target.
This serves two purposes:
- firstly, imaging at a depth greater than necessary results in a smaller target as the display is a finite size. A smaller target is generally more difficult to visualize and subsequently approach with the needle (Fig. 4b).
- secondly, minimizing the depth optimizes temporal resolution. Temporal resolution may be thought of as the frame rate and refers to the rate at which consecutive unique images are produced (expressed in frames per second) to culminate in continuous real-time imaging.
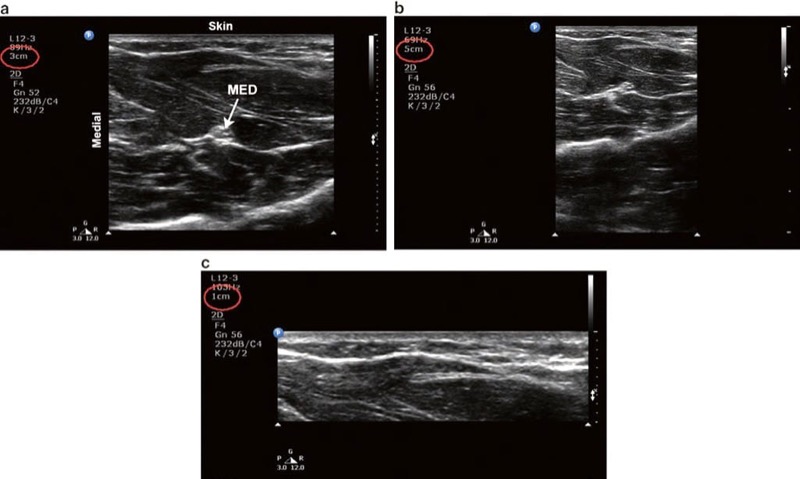
Fig. 4 Depth. (a) Optimal depth setting. The median nerve (MED) and surrounding musculature are apparent. (b) Excessive depth setting. The depth setting is too deep such that the relative size of the target structures is diminished. (c) Inadequate depth setting. The MED is not visible
Temporal resolution is dependent upon the rate at which successive US waves are emitted to form a full sector beam (usually in the order of thousands per second). Because US waves are actually emitted in pulses, with the next pulse emitted only when the previous one has returned to the transducer, it follows that for deeper structures this overall emission rate must be slower. Temporal resolution is thus forfeited as the depth is increased in yet another trade-off between functions as described above. Modern US machines preserve temporal resolution by reducing the width of the sector beam, which explains the automatic narrowing of the screen image as the depth is increased. Reducing the sector width effectively reduces the number of emitted waves that must return to the transducer, thereby reducing the time before an image is displayed and maintaining frame rate. Unlike during cardiac imaging, when visualizing moving objects is crucial, temporal resolution is of less importance in regional anesthesia and pain management. A low-frame rate, however, could still be significant by creating a blurred image during either needle movement or rapid injection of local anesthetic.
3. GAIN
The gain dial dictates how bright (hyperechoic) or dark (hypoechoic) the image appears. The mechanical energy of the echoes returning to the probe is converted by the US machine into an electrical signal, which in turn is converted into a displayed image. Increasing the gain amplifies the electrical signal produced by all these returning echoes which in turn increases the brightness of the entire image, including background noise (Fig. 5b). Care must be taken when adjusting the gain dial because, despite the perception by some novices that brighter is better, too much gain can actually create artifactual echoes or obscure existing structures. Similarly, too little gain can result in the operator missing real echo information (Fig. 5c). Finally, increasing the gain also reduces lateral resolution. Lateral resolution refers to the ability to distinguish objects side by side and is discussed in the next lessons.
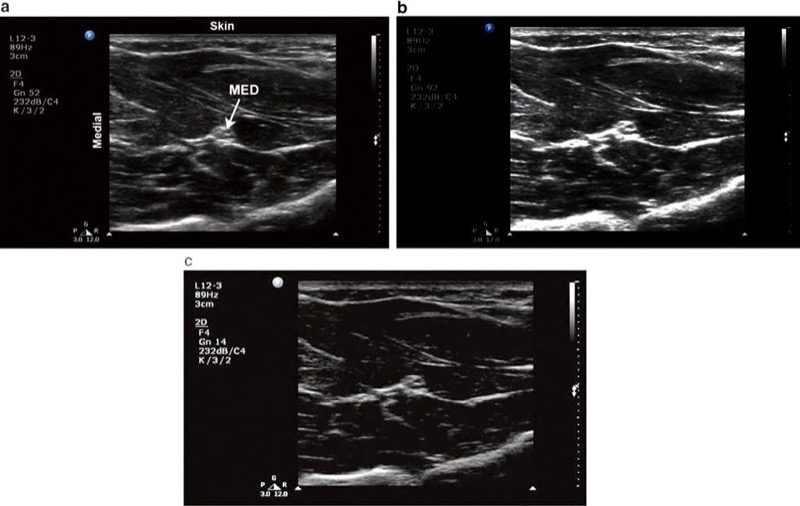
Fig. 5 Gain. (a) Optimal gain setting. The target median nerve (MED) and surrounding musculature in the forearm are apparent. (b) The gain is adjusted too high. (c) The gain is adjusted too low
4. TIME GAIN COMPENSATION
Similar to the gain dial, the TGC function allows the operator to make adjustments to the brightness. While the gain dial increases the overall brightness, TGC differs by allowing the operator to adjust the brightness independently at specific depths in the field (Fig. 6). In order to understand the purpose of TGC, one must fully appreciate the principle of attenuation. US waves passing through tissues are attenuated, mainly due to absorption but also as a result of reflection and refraction. Attenuation varies depending on both the beam frequency (higher frequency waves are attenuated more, as described above) and the type of tissue through which US travels (represented by the characteristic attenuation coefficient of each tissue type). Attenuation also increases with depth of penetration, and so if the machine actually displayed the amplitude of echoes returning to the probe, the image would be progressively darker from superficial to deep. This is because those waves returning from farther away would be more attenuated. While US machines are designed to automatically compensate for attenuation, the machine’s automatic correction is not always accurate. In order to create a more uniform image, TGC is most commonly adjusted to increase the brightness of structures in the far field (i.e., deep structures). While some machines have individual controls (“slide pots”) for each small segment of the display (Philips, GE), others have more simply “near” and “far” gain (SonoSite). When individual slide pots are present, the optimal configuration is usually to have the gain increasing slightly from superficial to deep to compensate for the attenuation described above.
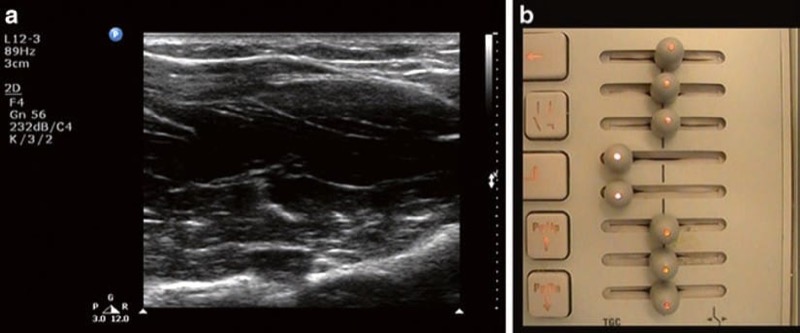
Fig. 6 Improper time gain compensation setting. (a) The median nerve is not visible due to the hypoechoic band in the center of the image. This is caused by an inappropriate low setting of the time gain compensation dial (b) which creates a band of under gain
5. FOCUS
The focus button is not present on all machines, but when available, it may be adjusted to optimize lateral resolution. Lateral resolution refers to the machine’s ability to distinguish two objects lying beside one another at the same depth, perpendicular to the US beam (Fig. 7). Multiple piezoelectric elements arranged in parallel on the face of the transducer emit individual waves which together produce a 3-D US beam. This 3-D US beam first converges (Fresnel zone) to a point where the beam is narrowest, called the focal zone, and then diverges (Fraunhofer zone) as it propagates through the tissue (Fig. 8).
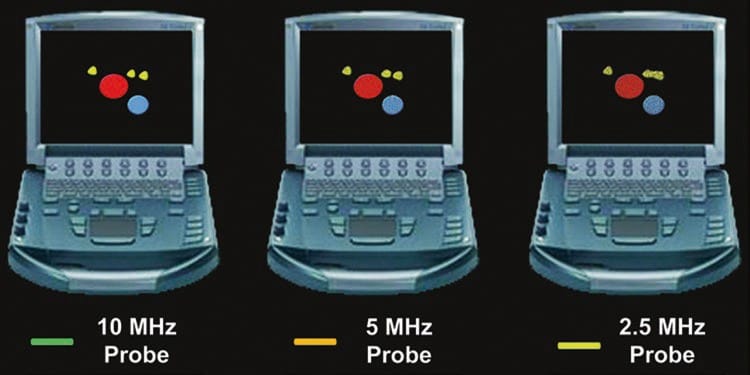
Fig. 7 Lateral resolution denotes the ability of the ultrasound machine to visually separate two structures lying beside one another in a direction perpendicular to the beam (x-axis). As frequency increases, lateral resolution increases, but depth of penetration decreases. Low frequency waves penetrate deeper at the expense of lateral resolution. Note how the ultrasound machine is increasingly unable to resolve each structure distinctly as the frequency decreases.
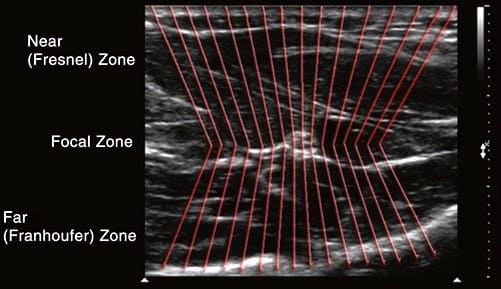
Fig.8 Focal zone. The focal zone is the boundary at which convergence of the beams ends and divergence begins. Lateral resolution is best in the focal zone. Lateral resolution denotes the ability of the ultrasound machine to correctly distinguish two structures lying side by side (x-axis)
Conceptually, when the beam diverges, the individual element waves no longer travel in parallel and become increasingly farther apart from one another. Ideally, each individual element wave would strike (and consequently produce a corresponding image) every point in the field, no matter how close two sepa- rate structures lie next to one another in the lateral plane. Target objects may be missed by “slipping in-between” two individual US waves if these are divergent. Limiting the amount of beam divergence therefore improves lateral resolution, and this is optimal at the level of the focal zone. The purpose of the focus dial is to allow the operator to adjust the focal zone to various depths in the field.
By positioning the focus at the same level as the target(s) of interest (Fig. 9), the amount of beam divergence can be limited and lateral resolution maximized accordingly. The focus level is generally represented by a small arrow at the left or right of the image. Some machines actually offer the ability to set multiple focal zones, but increasing the number of focal zones simultaneously degrades temporal resolution as the machine spends more time listening for returning echoes and processing each image.
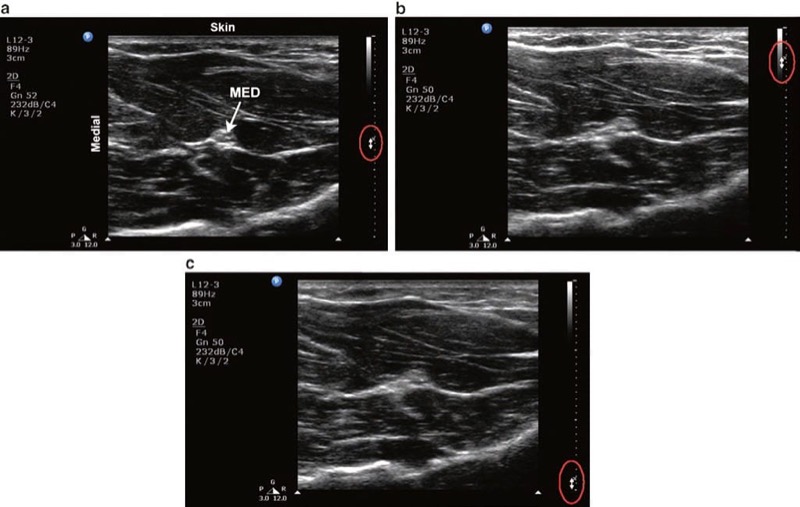
Fig. 9 Focus. (a) Correct focus setting for viewing the median nerve (MED) in the forearm. Bidirectional arrows along the right border of the image indicate the focus level setting. (b) The focus level is set too shallow. (c) The focus level is set too deep
6. PRESETS
All machines have presets which use a combination of the settings described above to create an image that is generally optimal for a particular tissue. At the most basic level, this may simply be set for nerves or vessels, but other machines may have settings for each particular nerve block. Although these provide a useful starting point, further manual adjustments are generally still required to compensate for patient size and condition.
7. COLOR DOPPLER
Color Doppler technology superimposes Doppler information on the real-time image and facilitates the identification and quantification (velocity, direction) of blood flow. The major benefit, however, of Doppler technology for anesthesiologists performing ultrasound-guided pain procedures is to confirm the absence of blood flow in the anticipated trajectory of the needle.
Doppler physics applied to ultrasound relate to the principle that if a sound wave is emitted from a stationary transducer and reflected by a moving object (usually red blood cells), the frequency of that reflected sound wave will change (Fig. 10). When blood is moving away from the transducer, the reflected wave will return at a lower frequency than the original emitted wave. This is represented by blue color. Conversely, when blood is moving toward the transducer, the reflected wave returns at a higher frequency than the original emitted wave. This is represented by a red color. Operators should be aware that red is not necessarily associated with arterial blood nor blue with venous blood. The above change in frequency is known as the Doppler shift, and it is this principle that can be used in cardiac and vascular applications to calculate both blood flow velocity and blood flow direction. The Doppler equation states that where:
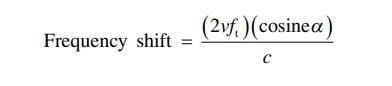
v is the velocity of the moving object, ft is the transmitted frequency, α is the angle of incidence between the US beam and the direction of blood flow, and c is the speed of US in the blood. It is also important to note that as the beam’s angle of incidence approaches 90°, large errors are introduced into the Doppler equation since the cosine of 90° is 0. In such instances, blood flow in a hypoechoic structure may not be visualized (i.e., false-negative – Fig. 11). Just as overall brightness can be adjusted using the gain function, the amount of Doppler signal displayed can also be adjusted. On some US machines, the Doppler sensitivity is adjusted by turning the gain knob while in Doppler mode.
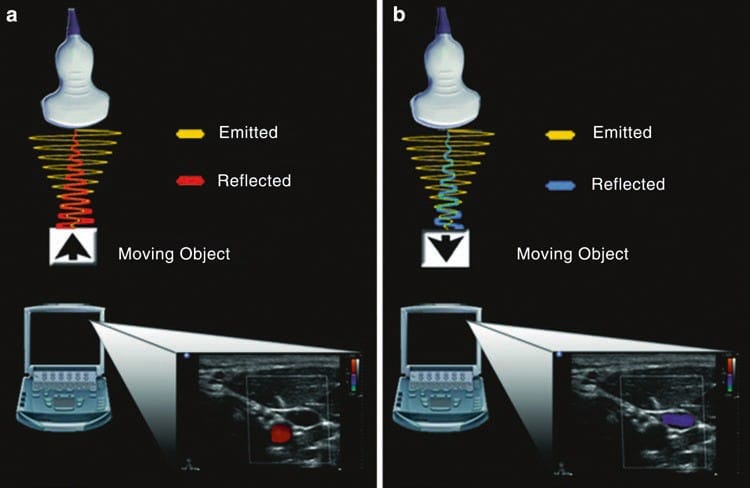
Fig.10 Doppler. (a) When a sound wave is emitted from the transducer and reflected from a target object moving toward the transducer, the returning frequency will be higher than the original emitted sound wave. The corresponding image on the ultrasound machine is represented by a red color. (b) Conversely, if the target object is moving away from the transducer, the returning frequency will be lower than the original emitted sound wave. The corresponding image on the ultrasound machine is represented by blue color.
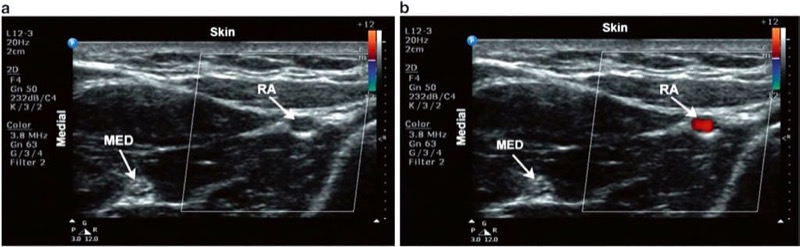
Fig. 11 Color Doppler. Short axis view of the radial artery. (a) No flow is apparent when the beam is perpendicular to the direction in which blood is flowing. (b) Adjusting the tilt of the probe alters the angle of insonation and consequently displays blood flow.
Other machines have a separate Doppler sensitivity knob. It should be noted however that increasing the Doppler sensitivity may result in the production of motion artifacts (i.e., false positive) created by subtle patient movements.
When in Doppler mode, the US machine requires more time to process returning echoes compared to simple B-mode imaging, and so temporal resolution may be reduced. This explains why only a small area of the image (usually a rectangle or parallelogram) is monitored for Doppler shift when this function is turned on. The operator may subsequently move this shape over desired targets using either a trackball or touchpad.
8. POWER DOPPLER
Power Doppler is a newer US technology that is up to five times more sensitive in detecting blood flow than color Doppler and can therefore detect vessels that are difficult or impossible to see using standard color Doppler. A further benefit is that, unlike color Doppler, power Doppler is almost angle independent, reducing the incidence of false negatives described above. Such advantages however come at the expense of more motion artifact with subtle movements such as respiration. One further disadvantage of power Doppler is that it cannot resolve the direction of flow. Rather than displaying a blue or red color therefore, only one color (usually orange) is used in a range of hues to indicate flow.
9. COMPOUND IMAGING
Compound imaging is one of the more recent technological advances in US. It improves image quality compared with conventional US by reducing speckle and other acoustic artifacts and improves the definition of tissue planes and needle visibility (Fig. 12).
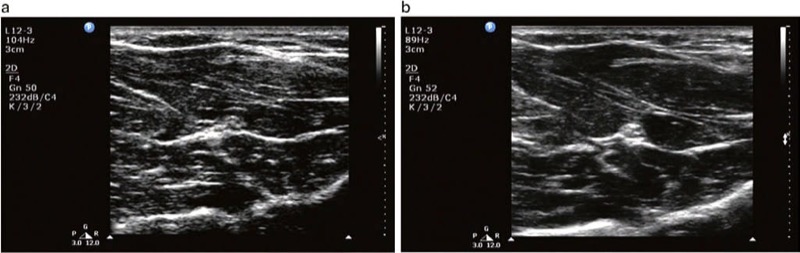
Fig. 12 (a) Compound imaging in off mode. (b) Compound imaging in on mode. Note the greater speckle artifact and reduction in resolution in (a) compared to (b)
Conventional US transducers emit sound waves in one direction, perpendicular to the transducer. Modern compound imaging transducers can simultaneously emit and “steer” ultrasound waves at a variety of angles, therefore producing images of the same tissue from several different angles of insonation (Fig. 13). Compound imaging works by electronically combining the reflected echoes from all the different angles to produce a single high-quality image (spatial compound imaging). Frequency compound imaging is similar but uses differing frequencies rather than insonation angles to create a single image.
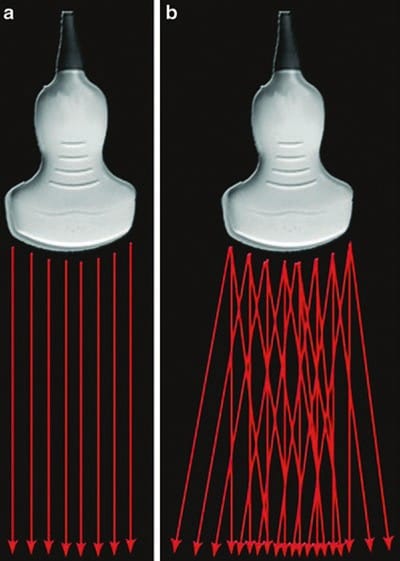
Fig.13 Beam steer. (a) Conventional ultrasound transducer emitting sound waves in one direction. (b) Compound imaging transducer emitting sound waves at a variety of angles.
10. TISSUE HARMONIC IMAGING
THI is another relatively new technology. When sound waves travel through the body tissue, harmonic frequencies are generated (Fig. 14). These harmonic frequencies are multiples of the original, fundamental frequency. When THI is avail- able, the transducer preferentially captures these higher frequency echoes upon their return to the probe for image processing. Because the harmonic frequencies are higher, there is enhanced axial and lateral resolution with reduced artifact. A further important point is that, unlike the conventional US, these higher frequencies are achieved without sacrificing depth of penetration. THI appears to particularly improve visualization of hypoechoic, cystic structures, although it has been reported to worsen needle visibility.
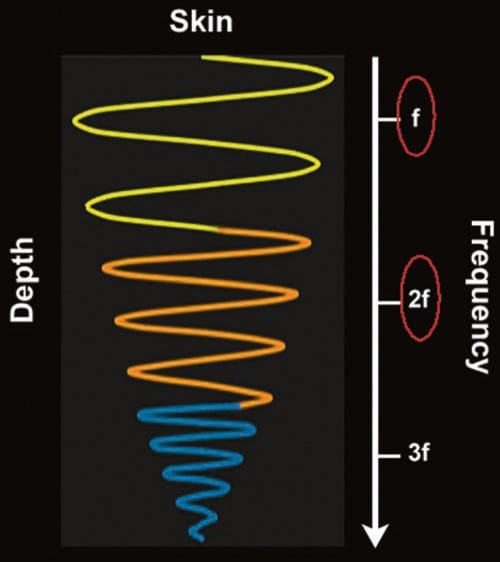
Fig. 14 Tissue harmonics. As the ultrasound wave travels through tissue, distortion of the wave occurs along the way. The resultant distorted waves are harmonics (multiples) of the fundamental (inputted) frequency (f). Higher frequencies, such as 2f, 3f, etc., result in greater resolution. In tissue harmonic imaging, the ultrasound machine filters out most frequencies, including the fundamental frequency, and preferentially “listens” to one of the harmonics, usually the second harmonic (2f), resulting in an image with superior axial and lateral resolution and also fewer artifacts
11. OPTIMIZATION BUTTON
Many newer machines now implement an automatic image optimization button which serves to instantaneously combine many of the aforementioned features to create the “ideal image.” This can be a simple, effective, and quick way to improve the quality of the image though further manual adjustments are sometimes still required.
12. FREEZE BUTTON AND IMAGE ACQUISITION
US imaging is a dynamic process. The image however is actually made up of a number of “frames” per second (temporal resolution, as described above) that change quickly enough to produce what effectively appears as a real-time display. The freeze button displays the current image on the screen but usually also allows a sequential review of the individual “frames” over a previous short period of time. Such images can then be stored if desired. Image acquisition is important for medicolegal records, teaching, and (less commonly when performing nerve blocks) making measurements. Most machines have the capacity to store still and video images.


PRACTICAL
Learn with Step-by-Step guide by the leading USPM experts

BE INSPIRED
Memorize ultrasound patterns with visual aids and create your own scripts with NOTES tool and never loose them.

UNDERSTAND
Every important aspect of ultrasound-guided pain interventions

READ OR LISTEN.
Learn according to your study style. Read or listen to the voiced-over material.